What Is a Sideways Trend, What Causes It, and Its Effects
Financial markets are often described in simple directional terms: prices go up, prices go down, or prices stay flat. While upward and downward trends receive the most attention, a large portion of market history is actually spent moving sideways. These periods, often overlooked or misunderstood, play a crucial role in shaping price behavior, market psychology, and long-term outcomes for traders and investors in many assets alike, whether in commodity, forex, stocks, bonds, or even real estates market.
A sideways trend is not merely a pause between trends. It reflects deeper dynamics within the market—shifts in expectations, balance between buyers and sellers, information gaps, and structural changes. Understanding sideways trends provides insight into how markets digest information, how uncertainty manifests in price, and why not all market activity results in visible progress.
This article explores sideways trends in depth: what they are, why they occur, how they form across different markets, and how they influence traders and investors from psychological, structural, and behavioral perspectives. This article is not for financial advice and not a predictions of future price. Just a collection of information.
1. What Is a Sideways Trend?
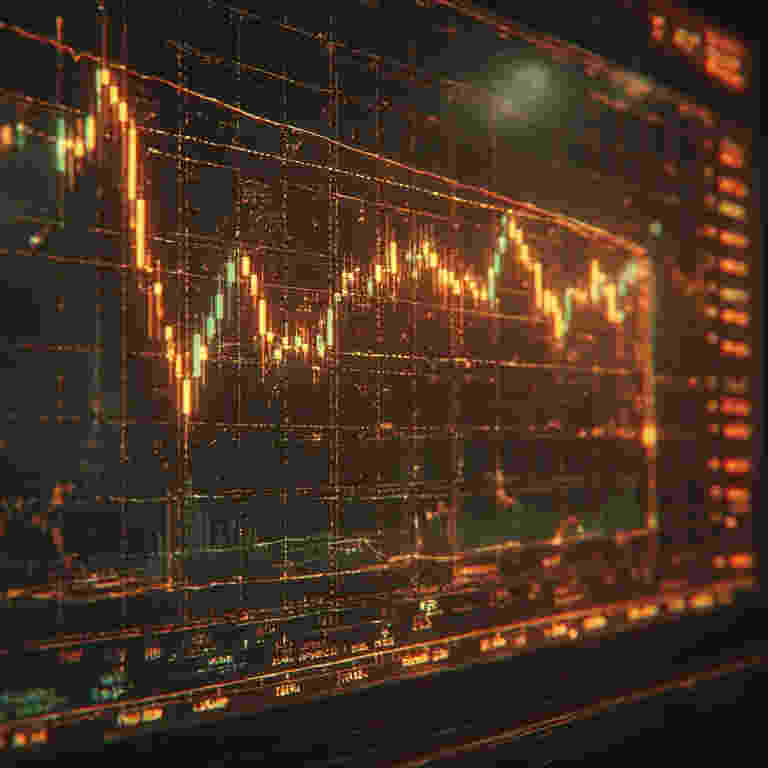
A sideways trend occurs when the price of a financial asset moves within a relatively stable horizontal range over an extended period. Instead of forming higher highs or lower lows, price oscillates between a defined upper boundary (often called resistance) and a lower boundary (often called support).
In essence, the market lacks a sustained directional bias.
A sideways trend is also commonly referred to as:
- A range-bound market
- Consolidation
- Horizontal movement
- Market balance
- Non-trending phase
During this period, price action reflects equilibrium rather than dominance by buyers or sellers.
2. Defining Characteristics of a Sideways Trend
Sideways trends have distinct features that separate them from trending markets.
Horizontal Price Structure
Price fluctuates within a range rather than advancing upward or downward over time. The highs and lows remain relatively consistent.
Lack of Momentum
Momentum indicators often flatten, reflecting the absence of strong directional force.
Reduced Trend Strength
Traditional trend measurements show weak or neutral readings, indicating that neither bullish nor bearish forces are in control.
Repetitive Price Behavior
Price frequently revisits the same zones, leading to repeated tests of boundaries without sustained breakouts.
Time-Based Development
Sideways trends often last longer than expected. While trends can move quickly, consolidation can persist for weeks, months, or even years.
3. Why Sideways Trends Exist
Sideways trends are not anomalies. They are a natural outcome of how markets function.
Markets move because participants act on information. When information is unclear, conflicting, or fully priced in, price movement slows and stabilizes.
Sideways trends represent indecision, digestion, and balance.
4. The Role of Supply and Demand Balance
At the core of every sideways trend is a balance between supply and demand.
- Buyers believe the asset is fairly priced or undervalued at lower levels.
- Sellers believe the asset is fairly priced or overvalued at higher levels.
- Neither group is strong enough to overwhelm the other.
This equilibrium results in repeated buying and selling around similar price levels.
Unlike trending markets—where one side consistently dominates—sideways markets reflect negotiation rather than conviction.
5. Uncertainty and Conflicting Information
One of the most common causes of sideways trends is uncertainty.
Markets enter sideways phases when:
- Economic data sends mixed signals
- Corporate outlooks are unclear
- Monetary policy direction is uncertain
- Geopolitical risks are unresolved
- Valuations are debated but not rejected
When participants disagree on future outcomes, price stalls.
Sideways movement is the market’s way of saying: “We don’t know yet.”
6. Sideways Trends After Strong Price Moves
Sideways trends frequently follow strong upward or downward moves.
After a significant move:
- Early participants take profits
- New participants hesitate to enter
- Valuation concerns increase
- Expectations stabilize
This results in consolidation as the market absorbs prior movement.
Rather than reversing immediately, price often pauses and builds a new base.
7. The Absence of New Catalysts
Markets require catalysts—new information—to drive sustained movement.
Sideways trends often occur when:
- Major economic events have passed
- Earnings seasons end
- Central bank decisions are already priced in
- News flow slows
Without new inputs, price remains trapped within established boundaries.
8. Market Expectations and Sideways Behavior
Expectations play a central role in sideways trends.
When expectations are:
- Clearly optimistic → uptrend
- Clearly pessimistic → downtrend
- Evenly divided → sideways trend
Sideways markets reflect consensus uncertainty rather than consensus direction.
This explains why sideways trends often end abruptly when expectations shift decisively.
9. Institutional Participation and Price Stability
Large institutional participants influence sideways trends.
Institutions:
- Accumulate positions gradually
- Avoid moving price aggressively
- Require time to deploy capital
- Often operate within ranges
This behavior can suppress volatility and reinforce sideways movement, especially in large, liquid markets.
10. Sideways Trends Across Different Asset Classes
Sideways trends appear across all markets, but their characteristics vary.
Stocks
Sideways trends in stocks often occur:
- After earnings
- During valuation debates
- When growth outlooks are uncertain
Forex
In currency markets, sideways trends frequently emerge when:
- Interest rate expectations converge
- Central banks signal neutrality
- Economic differentials narrow
Commodities
Sideways trends in commodities can result from:
- Balanced supply and demand
- Seasonal transitions
- Inventory normalization
While the structure is similar, the underlying causes differ by market.
11. Timeframe Dependency of Sideways Trends
A sideways trend on one timeframe may be part of a trend on another.
- Daily sideways movement can exist within a weekly trend
- Monthly consolidation can hide shorter-term volatility
This multi-timeframe nature adds complexity to interpretation and perception.
12. Sideways Trends and Volatility
Sideways trends are often associated with lower volatility, but not always.
Some sideways markets:
- Are quiet and narrow
- Exhibit frequent but contained swings
Others:
- Are volatile but directionless
- Produce sharp moves that reverse quickly
This unpredictability can challenge assumptions about risk and stability.
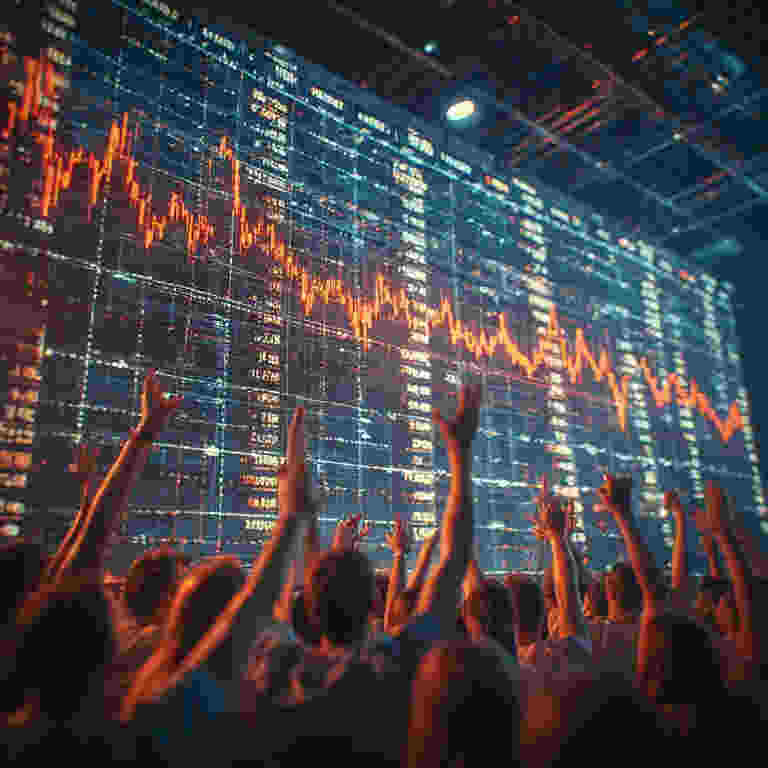
13. Psychological Effects on Traders
Sideways trends can be psychologically demanding for traders.
Common emotional responses include:
- Frustration due to lack of progress
- Overconfidence from short-term wins
- Impatience leading to overactivity
- Confusion caused by false signals
Humans are wired to seek patterns and direction, making sideways markets mentally exhausting.
14. Psychological Effects on Investors
For investors, sideways trends test conviction.
Long periods without price appreciation can lead to:
- Doubt about long-term theses
- Opportunity cost concerns
- Loss of engagement
- Re-evaluation of expectations
Sideways markets force investors to focus on fundamentals rather than price action.
15. The Concept of Opportunity Cost
One of the most overlooked impacts of sideways trends is opportunity cost.
Capital tied up in non-moving assets:
- Does not compound
- May lag alternative assets
- Can reduce overall portfolio momentum
This does not imply loss, but stagnation relative to other opportunities.
16. Sideways Trends and Market Participation
During sideways markets:
- Speculative participation often declines
- Volume may decrease
- Long-term participants dominate
This change in participation alters market dynamics and price behavior.
17. False Breakouts and Whipsaws
Sideways trends are often associated with false signals.
Price may:
- Briefly break above resistance
- Quickly reverse
- Create misleading directional cues
This phenomenon reflects the absence of sustained conviction.
18. Information Processing and Consolidation
Sideways trends represent a market processing phase.
Markets:
- Digest past information
- Evaluate future possibilities
- Adjust positioning gradually
This process is invisible but essential for long-term stability.
19. Sideways Trends as Structural Foundations
Many major trends begin with long sideways periods.
Consolidation allows:
- Weak participants to exit
- Stronger hands to accumulate
- Expectations to realign
Sideways markets are often the foundation for future expansion or contraction.
20. Sideways Trends and Economic Cycles
Sideways trends often align with transitional economic phases:
- Late-cycle uncertainty
- Early recovery hesitation
- Policy transition periods
They reflect macro-level indecision rather than micro-level inefficiency.
21. Media Interpretation of Sideways Markets
Sideways markets are often described as:
- “Boring”
- “Stagnant”
- “Dead”
In reality, they are periods of significant underlying change, just without visible price movement.
22. Sideways Trends and Long-Term Market Health
Sideways trends contribute to market health by:
- Preventing unsustainable momentum
- Allowing valuations to normalize
- Reducing systemic risk
Markets that never consolidate are more prone to instability.
23. Behavioral Biases Exposed by Sideways Trends
Sideways markets expose biases such as:
- Action bias (need to do something)
- Recency bias (expecting trends to continue)
- Confirmation bias (seeing direction where none exists)
These periods challenge discipline and patience.
24. Sideways Trends vs Market Efficiency
Sideways trends are not signs of inefficiency.
They reflect:
- Efficient pricing of known information
- Lack of new decisive inputs
- Balanced expectations
Efficiency does not require movement—only accurate reflection of information.
25. Long-Term Perspective on Sideways Markets
Over decades, markets move through repeated cycles of:
- Expansion
- Contraction
- Consolidation
Sideways trends are integral to this process.
They are not failures of the market, but expressions of its adaptive nature.
Conclusion
A sideways trend is more than a lack of direction. It is a manifestation of balance, uncertainty, and collective hesitation. These periods occur when markets pause to reassess, digest information, and recalibrate expectations.
Sideways trends shape trader psychology, test investor patience, and influence capital allocation decisions. While they may appear unproductive on the surface, they often play a critical role in preparing markets for future movement.
Understanding sideways trends provides deeper insight into how markets function—not just when prices move, but when they choose not to.


2 comments