 Polygon Forex Scalper Signal - NON REPAINT System Strategy Indicator + Alerts
POLYGON FOREX SCALPER Indicator is a Non-Repaint trading algorithm designed to detect high-value trade volatility and issues buy and sell trade recommendations for maximum profits
The POLYGON FOREX SCALPER System has been impeccably programmed. It catches very fast and profitable price movements and gives you easy BUY/ SELL signals. Every trading signal is very carefully verified by the system to produce only the highest probability trades.
Features
You can set the POLYGON FOREX SCALPER Indicator to send you a signal alert via email, Mobile Notification, or platform pop-ups. This is helpful as it means you do not need to stare at the charts all day waiting for signals to appear, and you can monitor multiple charts all at once.
POLYGON FOREX SCALPER Indicator System can be used on any Forex currency pair and other assets such as stocks, commodities, cryptos, precious metals, oil, gas, etc. You can also use it on any time frame that suits you best, from the 1 minute through to the 1-month charts.

Polygon Scalper is programmed to automatically adapt to current market conditions.
We know that there are no two identical trading sessions, and your trading strategy should adapt to the market.
Polygon Scalper uses an advanced polynomial algorithm that adjusts system parameters in real time.
Polygon Forex Scalper trading logic is very easy to understand for any trader.
Polygon uses statistical analysis to determine the future direction of the market (bull market / bear market) and find the optimal entry point into the market.
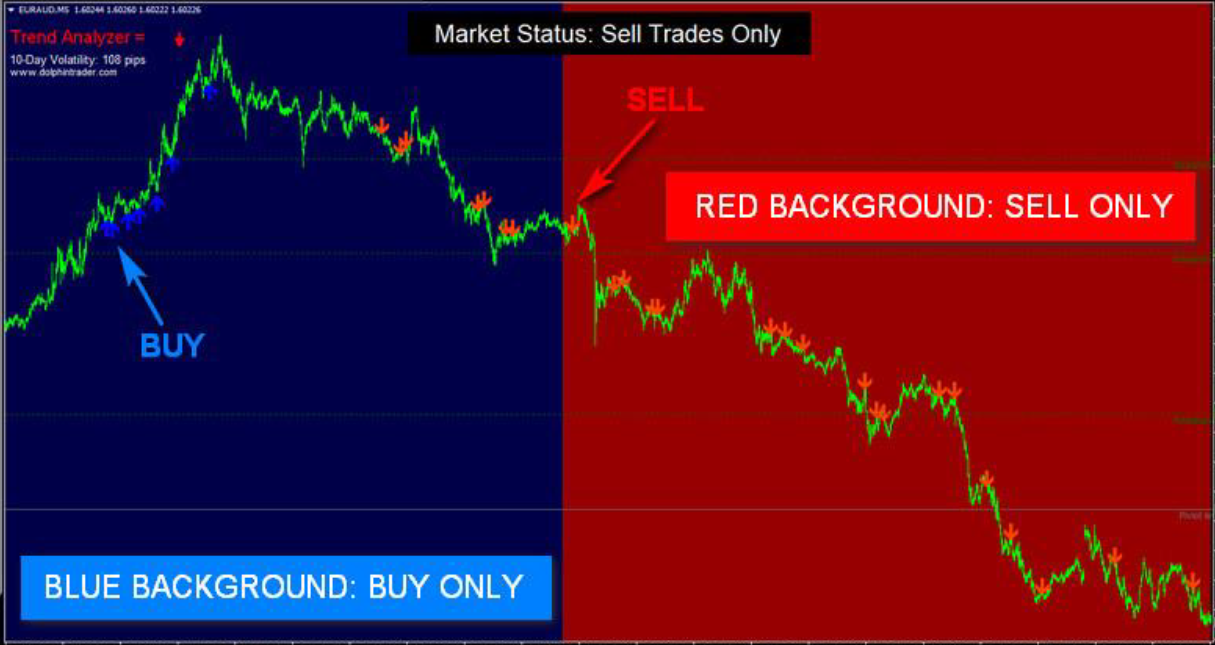
A very simple and clear graphic diagram will show you which market you are dealing with, as well as where to buy and sell at the same time.
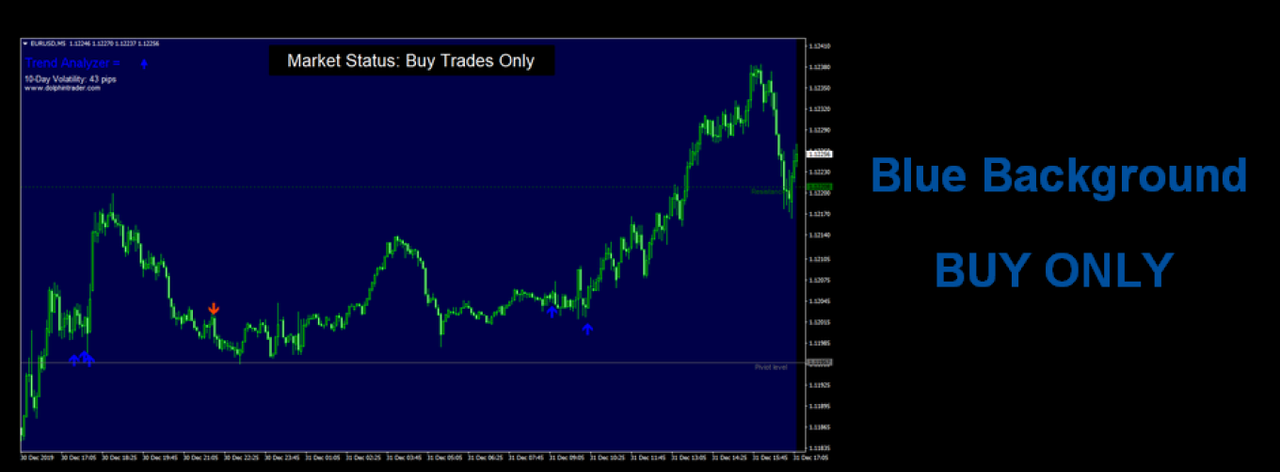
Blue background - we trade only blue buy signals. Ignore any red sell signal

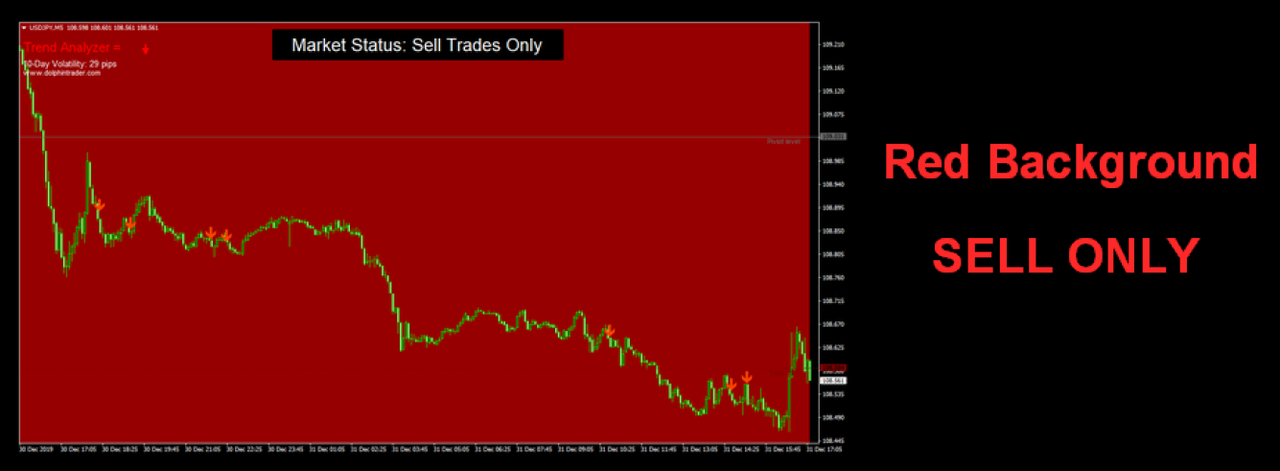
Red background - we trade only red sell signals. Ignore any blue buy signal

RULES AND EXAMPLES OF TRADE
The rules for entry, stop loss and take profit in Polygon Forex Scalper are very simple even for beginners.
A buy signal appears when the background is colored blue and a blue arrow appears on the chart.
A sell signal appears when the background is colored red and a red arrow appears on the chart.
Market status is based on the most relevant color background.
Buy ONLY when the background is blue.
Sell ONLY when the background is painted red.
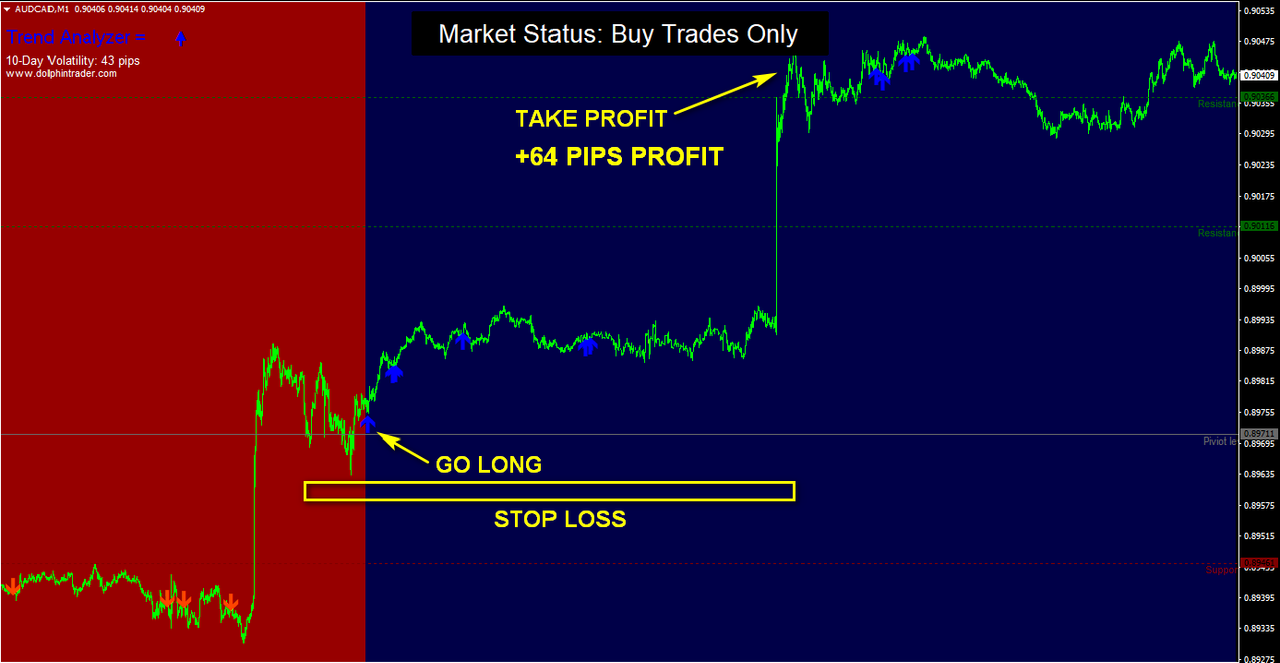
BUY TRADE example (AUD / CAD, chart M1)

Buy Trading Rules
The background should be blue.
The BLUE arrow appears on the chart.
Place a stop loss below the previous swing low.
Take profit in the risk reward ratio is 1: 3 or better (for example, risking 15 points, getting 45 points).
We ignore any red arrows when the background is blue! Therefore, if you opened a buy transaction when it worked, you would close it with a profit of 64 pips.
BUY THIS NOW!!! 


