The purpose of this website is to be a place for learning and discussion. The website and each tutorial topics do not encourage anyone to participate in trading or investment of any kind. Any information shown in any part of this website do not promise any movement, gains, or profit for any trader or non-trader.
Please do not spam in this forum
Spamming is causing issue to the site and will be completely banned
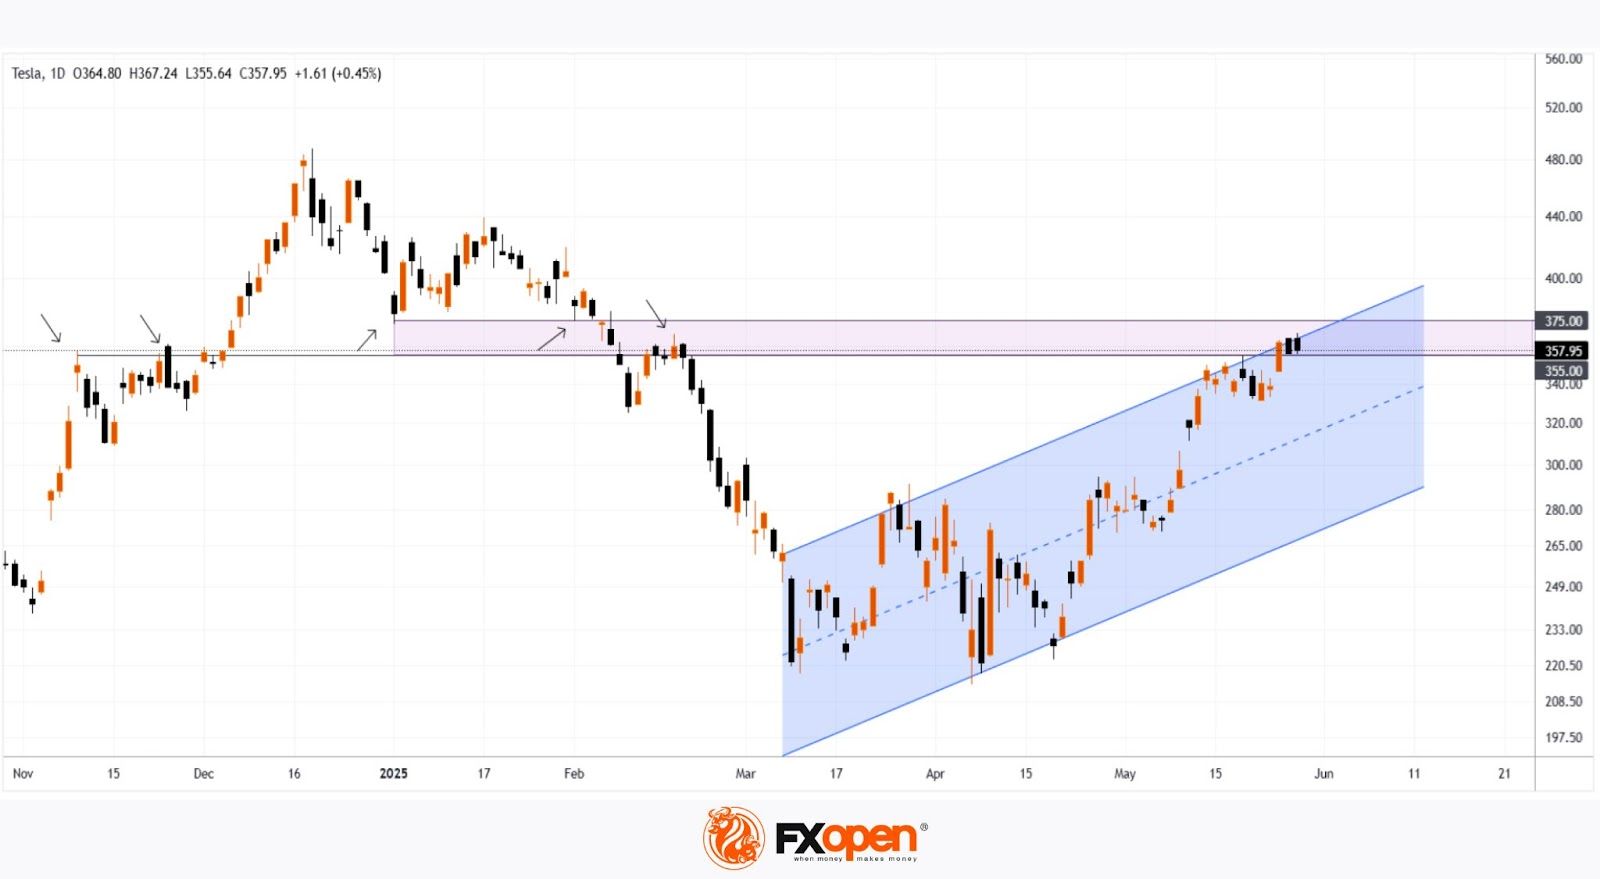
Musk Steps Away from Politics: What Does It Mean for Tesla (TSLA) Stock?
Yesterday, it was announced that Elon Musk will be stepping down from the Trump administration as his term as head of DOGE—where he focused on reducing government spending—has come to an end.
This decision follows his statement at the economic forum in Qatar, where Musk said he plans to focus less on politics, as he feels he has already done enough in that realm.
What Does This Mean for Tesla (TSLA) Stock? Musk’s move away from politics is likely a positive signal for investors. Here's why: → The company’s CEO can now devote more time to addressing issues such as declining vehicle sales in Europe; → Musk’s role at DOGE will no longer pose reputational risks for Tesla..
During yesterday’s main trading session, TSLA stock surged to $367—its highest level since mid-February.
Disclaimer: This article represents the opinion of the Companies operating under the FXOpen brand only (excluding FXOpen EU). It is not to be construed as an offer, solicitation, or recommendation with respect to products and services provided by the Companies operating under the FXOpen brand, nor is it to be considered financial advice.
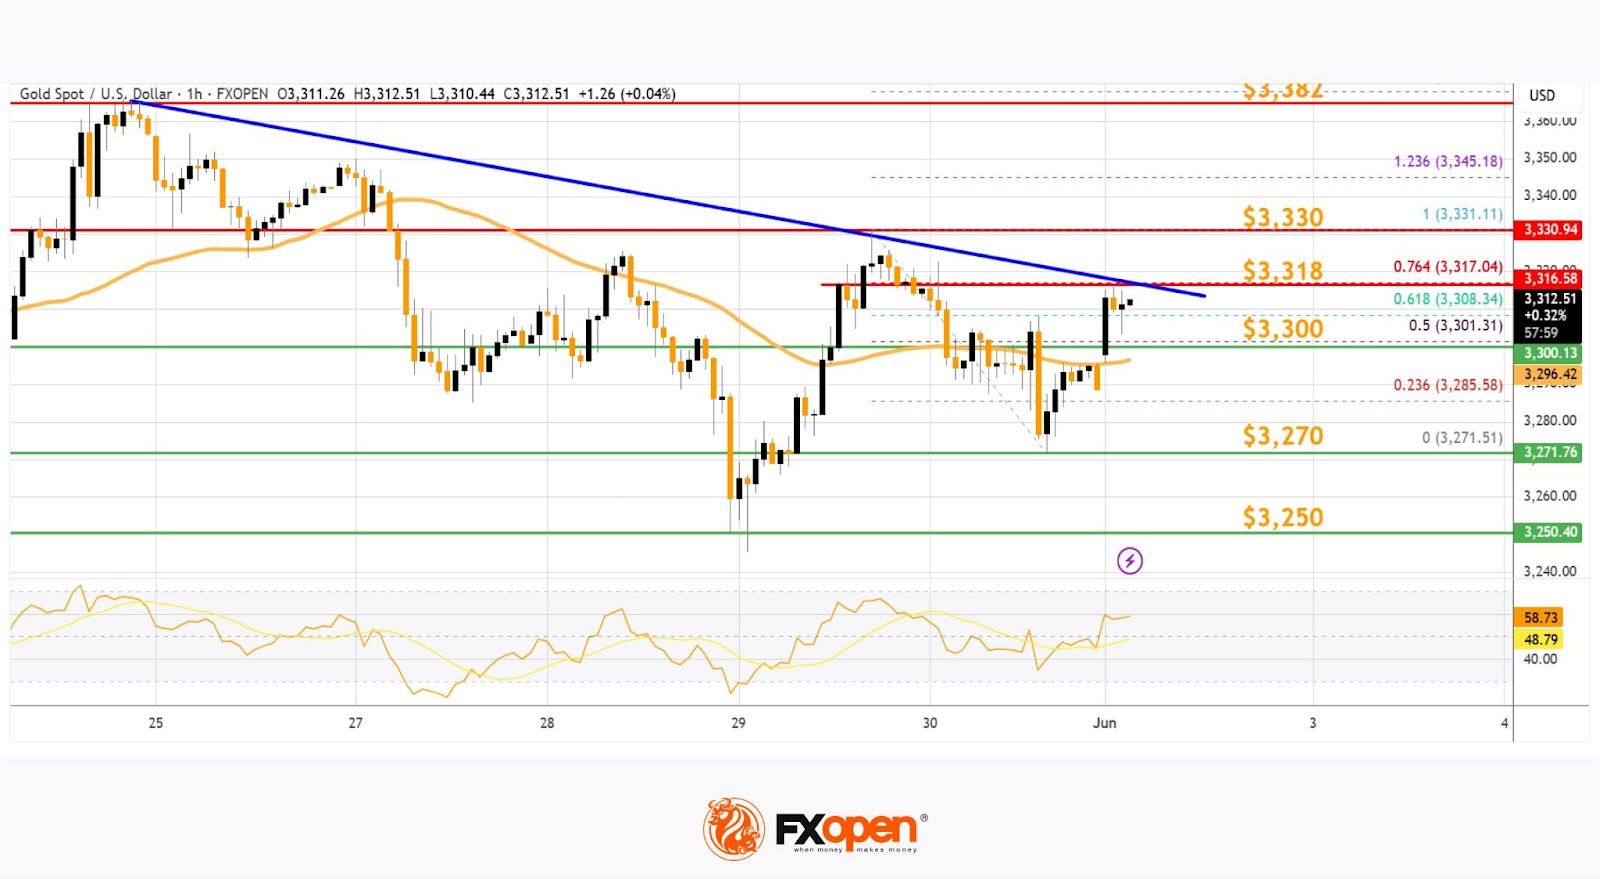
XAU/USD Chart Analysis: Gold Price Stabilises Around $3,300
Throughout May, a turbulent news backdrop — involving both international trade tariffs and armed conflicts — led to the formation of a peak around $3,430 and a low near $3,130 on the XAU/USD chart. As of today, the price per ounce stands around $3,300 — roughly the same level as at the beginning of the month.
This suggests that supply and demand forces are largely balanced, keeping the price contained between these extremes. The XAU/USD chart provides further confirmation, emphasising the significance of the $3,300 level.
Disclaimer: This article represents the opinion of the Companies operating under the FXOpen brand only (excluding FXOpen EU). It is not to be construed as an offer, solicitation, or recommendation with respect to products and services provided by the Companies operating under the FXOpen brand, nor is it to be considered financial advice.
Market volatility, characterised by rapid price fluctuations, presents both opportunities and challenges for traders. Understanding its causes, measuring it effectively, and employing strategies to capitalise on it can lead to better trading results. This article explores the essentials of market volatility, from its definition and measurement to strategies like breakout and swing trading.
Definition and Causes of Market Volatility
When discussing volatility and its meaning in finance, it’s typically defined as the degree of variation in a trading price series over a certain period. It is an essential aspect of the financial markets that signifies the fluctuation in the price of an asset or market index. High volatility means that the price of the asset is moving significantly over a short time, while low volatility indicates smaller price changes.
Disclaimer: This article represents the opinion of the Companies operating under the FXOpen brand only (excluding FXOpen EU). It is not to be construed as an offer, solicitation, or recommendation with respect to products and services provided by the Companies operating under the FXOpen brand, nor is it to be considered financial advice.
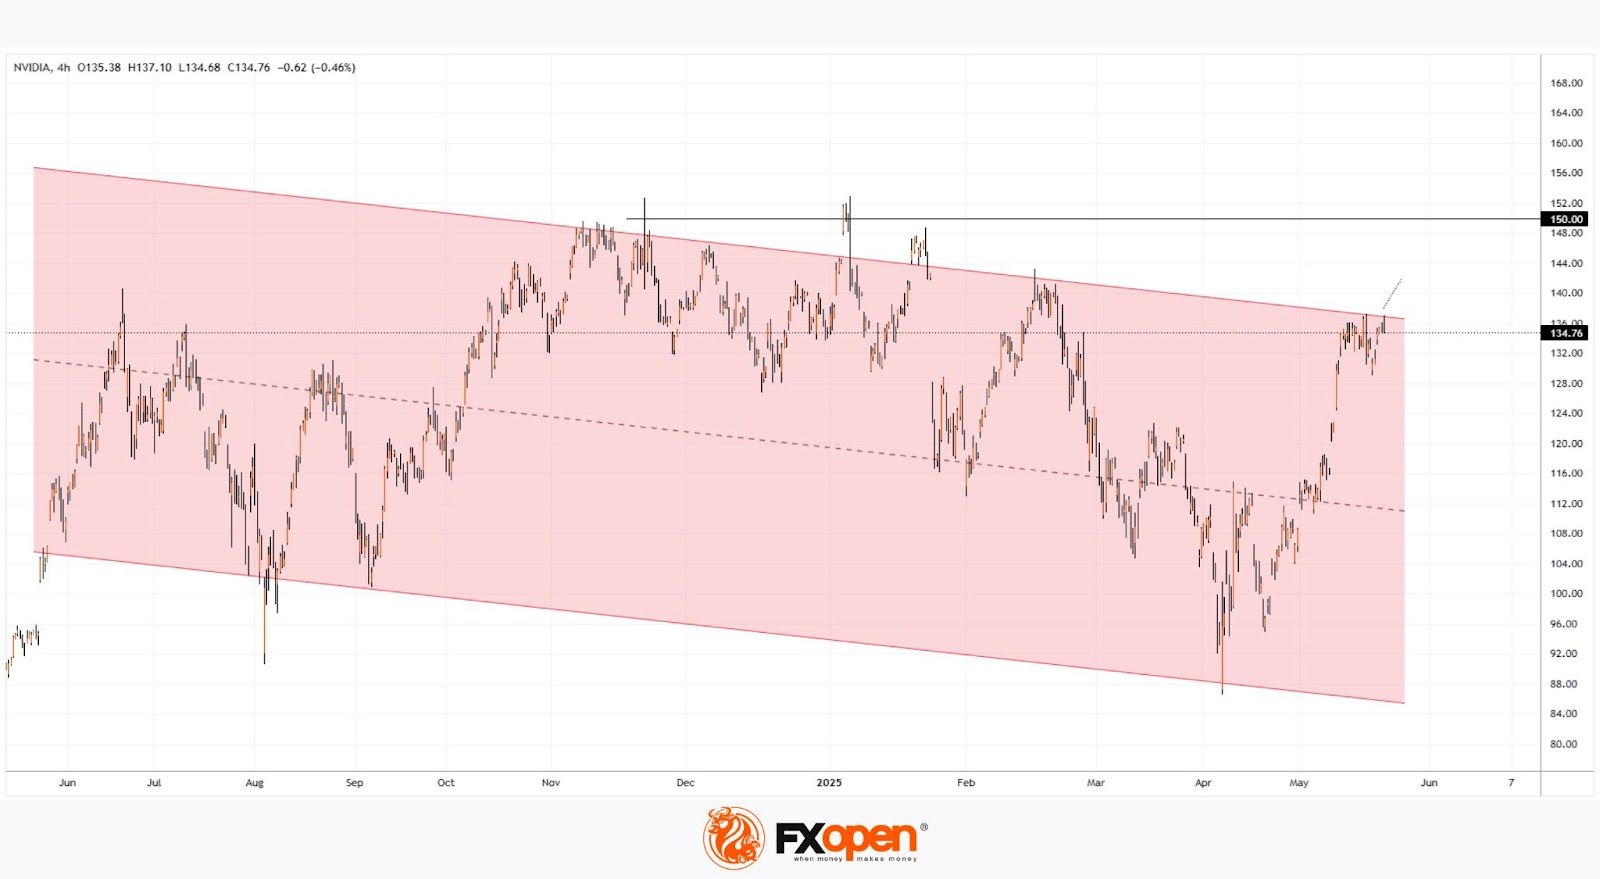
Nvidia (NVDA) Stock Price Rises Over 4% Following Earnings Report
Yesterday, after the main trading session, Nvidia released its quarterly earnings report, which exceeded analysts' expectations: → Earnings per share: actual = $0.81, forecast = $0.73 → Revenue: actual = $44 billion, forecast = $43.3 billion
Additionally, according to media reports, Nvidia issued a strong forecast for the next period, although CEO Jensen Huang noted difficulties in accessing the Chinese market, which he estimates to be worth $50 billion.
Nevertheless, market participants reacted positively. According to Google, in after-hours trading the NVDA stock price rose by more than 4%, surpassing the $140 level.
It is reasonable to assume that this initial positive reaction could continue during today’s main trading session.
Disclaimer: This article represents the opinion of the Companies operating under the FXOpen brand only (excluding FXOpen EU). It is not to be construed as an offer, solicitation, or recommendation with respect to products and services provided by the Companies operating under the FXOpen brand, nor is it to be considered financial advice.
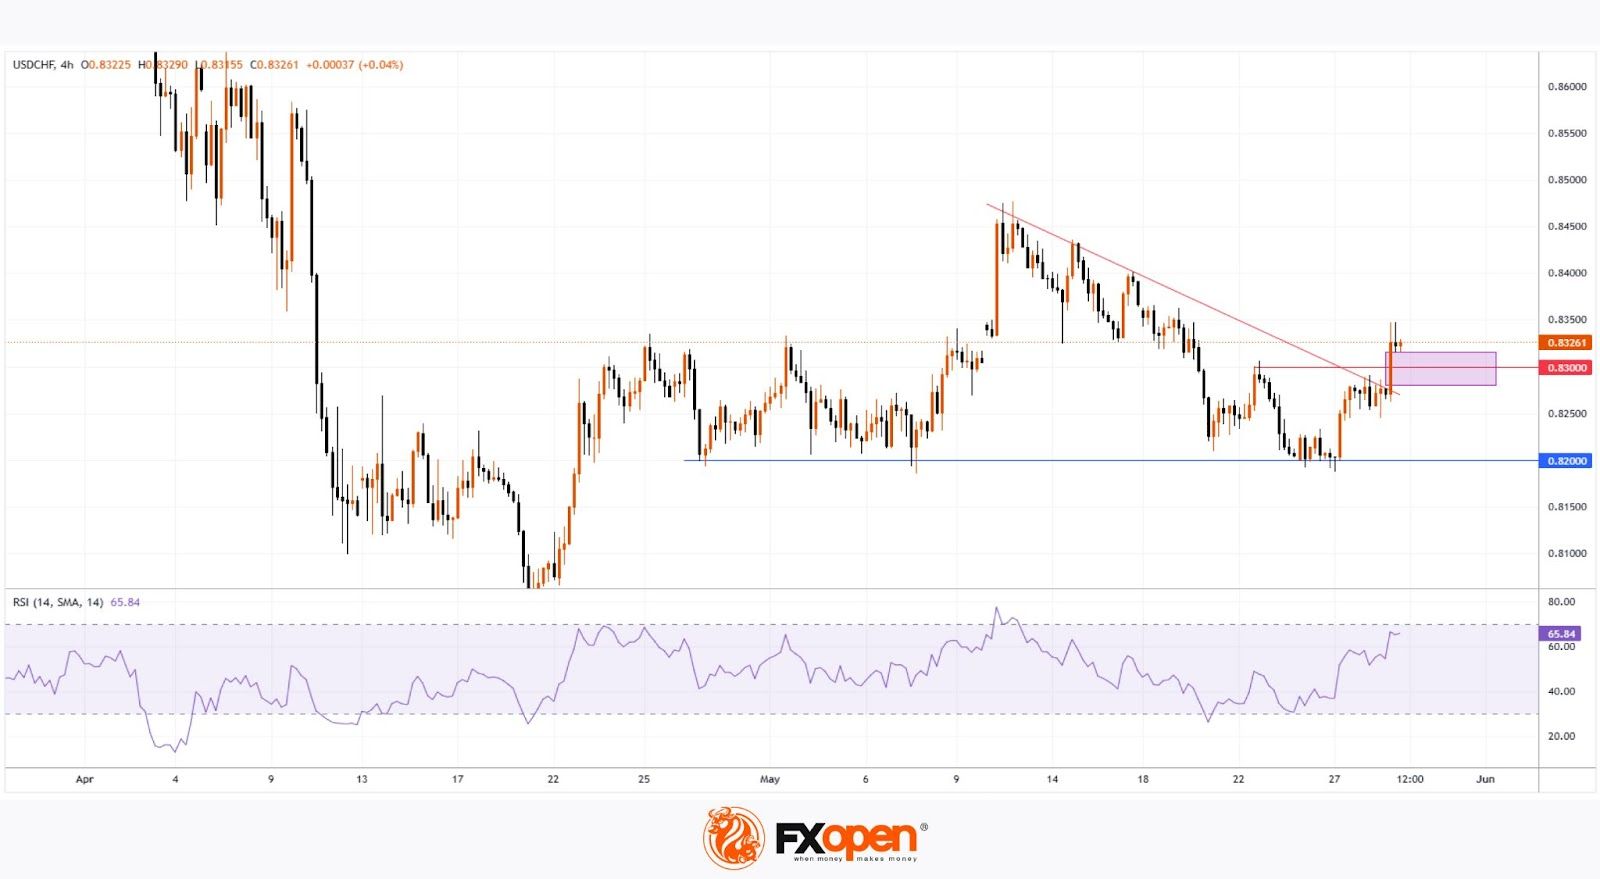
US Federal Court Rules Trump Tariffs Unconstitutional
According to media reports, the US Court of International Trade has:
declared the tariffs imposed by President Donald Trump illegal;
ruled that the President exceeded his authority;
blocked the tariffs, emphasising that under the US Constitution, only Congress has the power to impose tariffs.
The decision was made unanimously by a panel of three judges. Financial markets reacted with:
a rise in US stock indices;
strengthening of the US dollar — most notably seen today on the USD/CHF chart, as demand for so-called safe-haven assets declined in light of the tariff reversal.
Disclaimer: This article represents the opinion of the Companies operating under the FXOpen brand only (excluding FXOpen EU). It is not to be construed as an offer, solicitation, or recommendation with respect to products and services provided by the Companies operating under the FXOpen brand, nor is it to be considered financial advice.
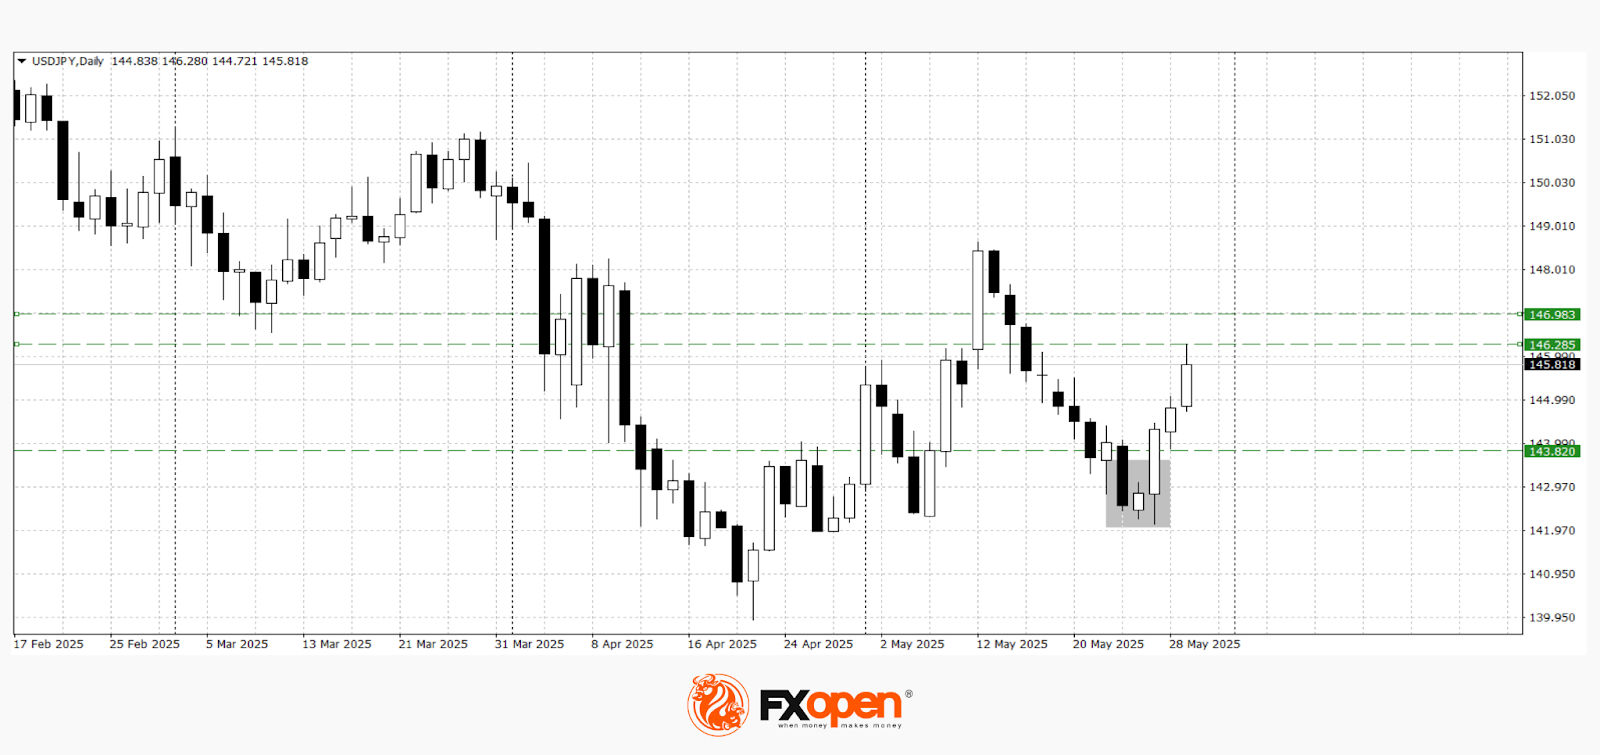
The USD/JPY and EUR/USD currency pairs are showing moderate corrections. Market participants are locking in profits and shifting to a wait-and-see approach after the release of the Federal Reserve's meeting minutes, in which the regulator reaffirmed its commitment to the current interest rate levels amid uncertainty about the macroeconomic outlook.
In the coming trading sessions, market attention will focus on a batch of statistics from the US, Japan, and the Eurozone. Today, weekly US jobless claims data and the second estimate of Q1 US GDP growth rate are expected. Tomorrow, the focus will shift to Japanese inflation data (CPI), unemployment rate, and industrial production, which could significantly impact the USD/JPY pair.
USD/JPY
The USD/JPY pair is trading near the 145.80 level, correcting in response to changes in Japanese government bond yields. The yield on 30-year bonds has dropped to 2.85% from last week’s high of 3.2%, while the yield on 10-year bonds fell to 1.46%. According to sources close to Japan’s Ministry of Finance, a survey among primary dealers indicates structurally low demand for long-term bonds — this could signal a future reduction in their issuance. Amid declining yields, the yen's strengthening has slowed, and interest in the dollar has stabilised.
Disclaimer: This article represents the opinion of the Companies operating under the FXOpen brand only (excluding FXOpen EU). It is not to be construed as an offer, solicitation, or recommendation with respect to products and services provided by the Companies operating under the FXOpen brand, nor is it to be considered financial advice.
In the dynamic world of trading, traders utilise diverse instruments to skillfully navigate the ever-changing market landscape. Within this toolbox, technical analysis shines as a crucial instrument, assisting traders in comprehending past price dynamics, chart patterns, and current market trends. This approach equips traders with the ability to craft educated forecasts concerning possible price fluctuations. This article aims to shed light on how to read RSI and MACD, providing insights into how these indicators may be harnessed to interpret and anticipate market trends.
What Is the MACD?
The MACD indicator is a popular tool used by traders to analyse and interpret market trends. It consists of three main components: two lines and a histogram.
Disclaimer: This article represents the opinion of the Companies operating under the FXOpen brand only (excluding FXOpen EU). It is not to be construed as an offer, solicitation, or recommendation with respect to products and services provided by the Companies operating under the FXOpen brand, nor is it to be considered financial advice.
Commodity Currencies Retreat from Highs Ahead of Fed Minutes Release
The AUD/USD and NZD/USD currency pairs are experiencing a corrective pullback after reaching medium-term highs earlier this week. This movement comes amid a broader reassessment of risk in anticipation of the release of the minutes from the latest Federal Reserve meeting. Investors and market participants are trimming positions in risk-sensitive assets, reacting to a mix of factors including monetary policy signals, geopolitical rhetoric, and tariff developments.
Additional pressure on commodity currencies was driven by today’s meeting of the Reserve Bank of New Zealand (RBNZ). As expected, the central bank cut its key interest rate, prompting further selling in the NZD/USD pair and fuelling speculation about potential further easing should global demand deteriorate.
The release of the FOMC minutes, scheduled for this evening, remains a key focus. Investors are looking for additional clues regarding the outlook for Federal Reserve policy easing in the second half of the year. In addition, Thursday’s US GDP data will be closely watched and may serve as a significant guide for short-term moves in the US dollar and commodity-linked currency crosses.
Technical Analysis of AUD/USD The AUD/USD pair is trading near the 0.6450 mark, correcting from recent highs. Support appears to lie around the 0.6400 level, while today’s release of the Fed minutes could trigger increased volatility in the pair. Technical analysis of AUD/USD suggests a potential decline towards the 0.6400–0.6370 range, as a "doji" candlestick pattern has formed on the daily timeframe.
Disclaimer: This article represents the opinion of the Companies operating under the FXOpen brand only (excluding FXOpen EU). It is not to be construed as an offer, solicitation, or recommendation with respect to products and services provided by the Companies operating under the FXOpen brand, nor is it to be considered financial advice.
In the second half of May, the British pound showed notable strength: from its 12 May low, GBP/USD climbed to a peak on 26 May — marking its highest level in over three years.
Demand for the pound has been driven by several factors:
→ A surge in inflation. CPI data released last Wednesday came in above expectations. As a result, market participants interpreted this as a reason for the Bank of England to remain cautious about cutting interest rates. Holding rates at elevated levels is generally considered bullish for the pound.
→ The pound’s relative resilience amid trade tensions, particularly following a newly signed agreement with the US, as well as strengthening trade ties between the UK and the EU.
Can the pound continue to rise? The GBP/USD chart offers reasons for doubt.
Disclaimer: This article represents the opinion of the Companies operating under the FXOpen brand only (excluding FXOpen EU). It is not to be construed as an offer, solicitation, or recommendation with respect to products and services provided by the Companies operating under the FXOpen brand, nor is it to be considered financial advice.
DELL Stock Price Analysis Ahead of Earnings Release
In addition to Nvidia’s (NVDA) quarterly report, this week financial market participants are also closely watching Dell Technologies’ (DELL) earnings release, scheduled for Thursday, 29 May, after the close of the trading session.
According to analysts cited by the media: → the company’s revenue is expected to come in at $23.18 billion (compared to $22.24 billion in the same period last year, and $23.9 billion in the previous quarter); → particular attention will be paid to Dell’s business segment focused on manufacturing servers for AI applications.
Notably, DELL’s price chart shares several similarities with the NVDA chart we analysed yesterday.
Disclaimer: This article represents the opinion of the Companies operating under the FXOpen brand only (excluding FXOpen EU). It is not to be construed as an offer, solicitation, or recommendation with respect to products and services provided by the Companies operating under the FXOpen brand, nor is it to be considered financial advice.
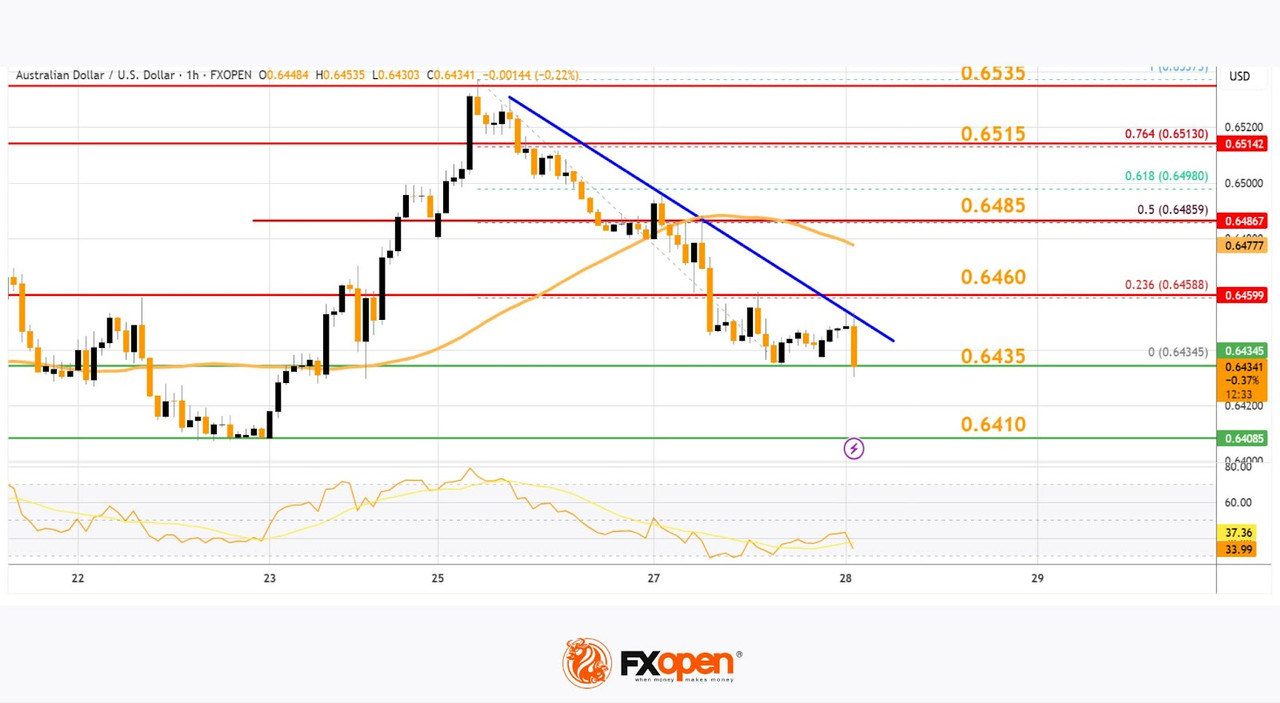
Market Analysis: AUD/USD and NZD/USD Face Pressure, Dip Again
AUD/USD declined below the 0.6500 and 0.6460 support levels. NZD/USD is also moving lower and might extend losses below 0.5935.
Important Takeaways for AUD/USD and NZD/USD Analysis Today
The Aussie Dollar started a fresh decline from well above the 0.6500 level against the US Dollar.
There is a connecting bearish trend line forming with resistance at 0.6460 on the hourly chart of AUD/USD at FXOpen.
NZD/USD declined steadily from the 0.6000 resistance zone.
There is a major bearish trend line forming with resistance at 0.5960 on the hourly chart of NZD/USD at FXOpen.
AUD/USD Technical Analysis
On the hourly chart of AUD/USD at FXOpen, the pair struggled to clear the 0.6520 zone. The Aussie Dollar started a fresh decline below the 0.6500 support against the US Dollar.
The pair even settled below 0.6460 and the 50-hour simple moving average. There was a clear move below 0.6450. A low was formed at 0.6435 and the pair is now consolidating.
On the upside, an immediate resistance is near the 0.6460 level and the 23.6% Fib retracement level of the downward move from the 0.6537 swing high to the 0.6435 low.
The next major resistance is near the 0.6485 zone or the 50% Fib retracement level of the downward move from the 0.6537 swing high to the 0.6435 low, above which the price could rise toward 0.6515.
Disclaimer: This article represents the opinion of the Companies operating under the FXOpen brand only (excluding FXOpen EU). It is not to be construed as an offer, solicitation, or recommendation with respect to products and services provided by the Companies operating under the FXOpen brand, nor is it to be considered financial advice.
In trading, Williams’ indicators stand out for their distinct approach to market analysis. Employed in many successful traders’ strategies, they can provide unique insights that help traders navigate the market with confidence. This article explores two key Williams’ strategies and provides insights into their applications, benefits, and potential challenges in the contemporary trading landscape.
Disclaimer: This article represents the opinion of the Companies operating under the FXOpen brand only (excluding FXOpen EU). It is not to be construed as an offer, solicitation, or recommendation with respect to products and services provided by the Companies operating under the FXOpen brand, nor is it to be considered financial advice.
Market volatility, characterised by rapid price fluctuations, presents both opportunities and challenges for traders. Understanding its causes, measuring it effectively, and employing strategies to capitalise on it can lead to better trading results. This article explores the essentials of market volatility, from its definition and measurement to strategies like breakout and swing trading.
Definition and Causes of Market Volatility
When discussing volatility and its meaning in finance, it’s typically defined as the degree of variation in a trading price series over a certain period. It is an essential aspect of the financial markets that signifies the fluctuation in the price of an asset or market index. High volatility means that the price of the asset is moving significantly over a short time, while low volatility indicates smaller price changes.
Disclaimer: This article represents the opinion of the Companies operating under the FXOpen brand only (excluding FXOpen EU). It is not to be construed as an offer, solicitation, or recommendation with respect to products and services provided by the Companies operating under the FXOpen brand, nor is it to be considered financial advice.
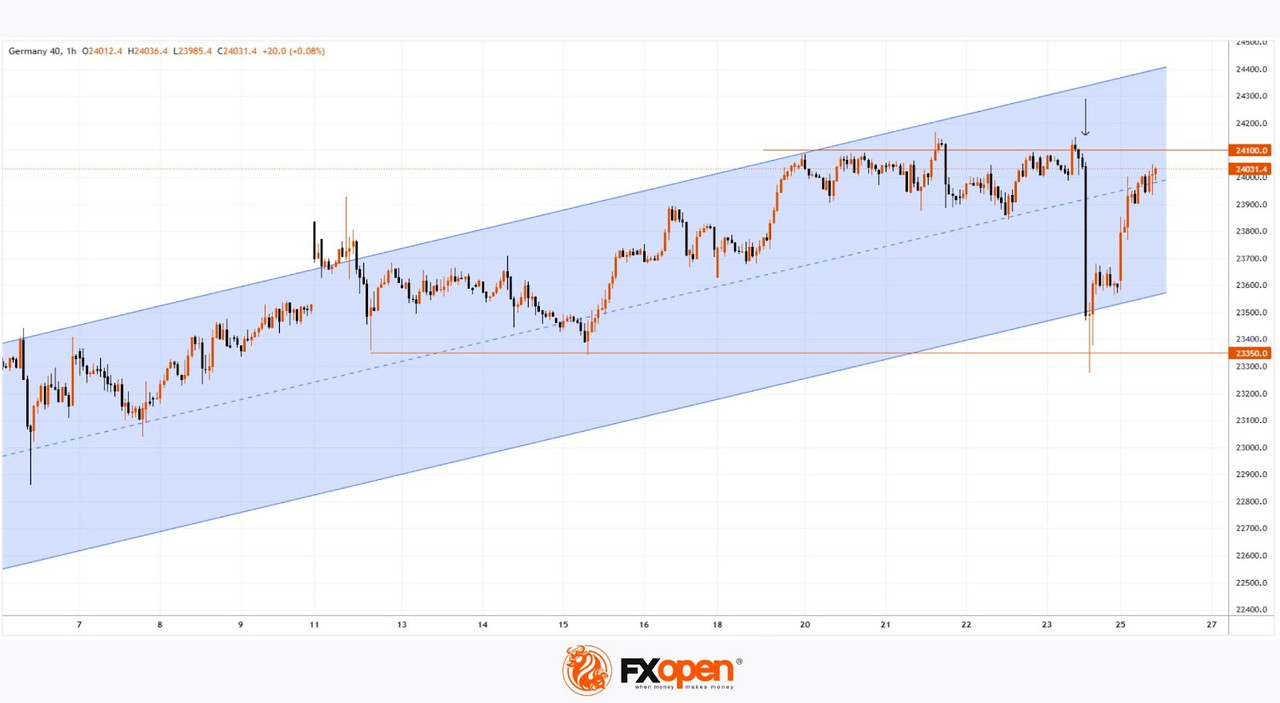
The German DAX 40 index (Germany 40 mini on FXOpen) is showing significantly stronger performance than other major global stock indices as of the end of May. For comparison, since the beginning of 2025:
→ The tech-heavy Nasdaq 100 has remained largely flat; → The S&P 500 is down by 1%; → Japan’s Nikkei 225 has fallen by approximately 4.5%.
Why Is Germany’s Stock Index Climbing? The rally may be driven by a combination of factors, including:
→ An ambitious fiscal stimulus programme launched by the German government, featuring substantial public investment in defence and infrastructure development.
→ A dovish monetary policy stance from the European Central Bank (ECB) amid slowing inflation. Expectations of further interest rate cuts in 2025 have made equities more attractive than bonds, drawing capital into the stock market.
Disclaimer: This article represents the opinion of the Companies operating under the FXOpen brand only (excluding FXOpen EU). It is not to be construed as an offer, solicitation, or recommendation with respect to products and services provided by the Companies operating under the FXOpen brand, nor is it to be considered financial advice.
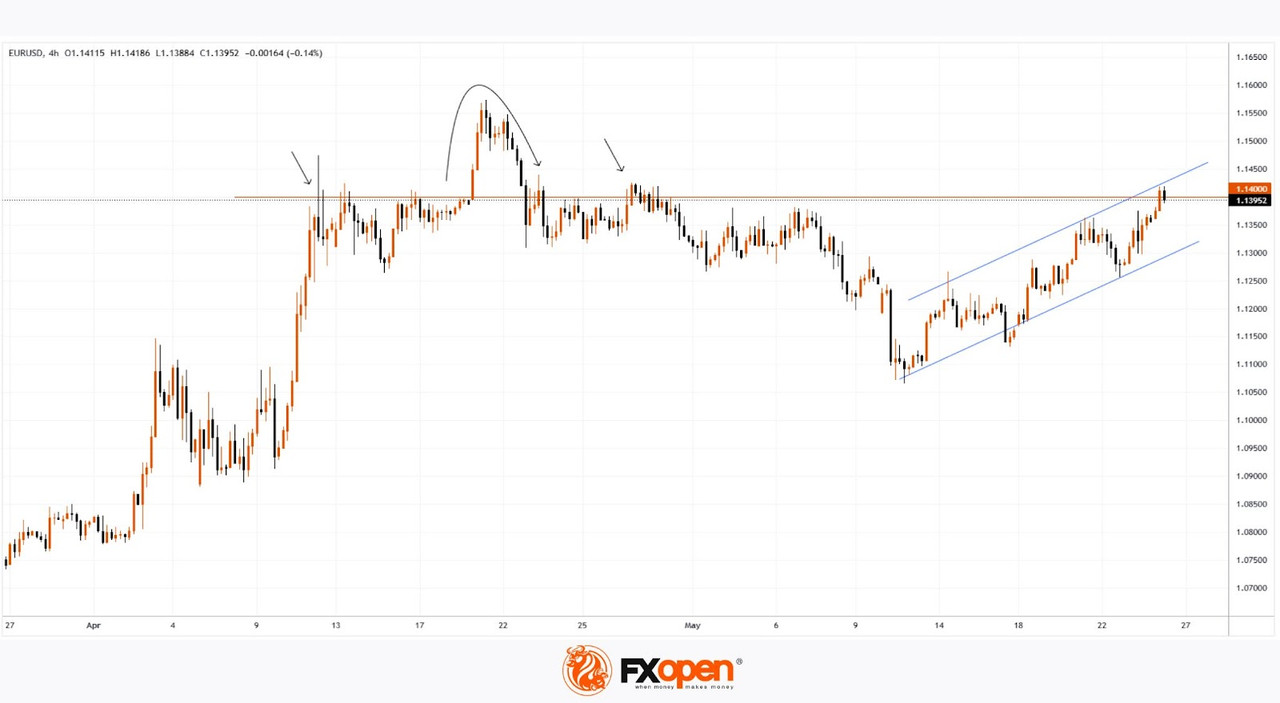
Although financial markets in both the US and the UK are closed for a public holiday today, Donald Trump is keeping traders on their toes. According to a fresh Reuters report, the US President has backed down from his threat to impose 50% tariffs on EU goods from 1 June, following a phone call from European Commission President Ursula von der Leyen, who urged him to allow time to “reach a mutually beneficial deal”.
This development has boosted the euro while weighing on the US dollar.
As today's EUR/USD chart shows, the euro has risen to its highest level against the dollar since early May. But can the upward trend continue?
Disclaimer: This article represents the opinion of the Companies operating under the FXOpen brand only (excluding FXOpen EU). It is not to be construed as an offer, solicitation, or recommendation with respect to products and services provided by the Companies operating under the FXOpen brand, nor is it to be considered financial advice.
Discussion Forum / 论坛 / منتدى للنقاش/ Diễn đàn thảo luận/
-
Disclaimer : The purpose of this website is to be a place for learning and discussion. The website and each tutorial topics do not encourage anyone to participate in trading or investment of any kind. Any information shown in any part of this website do not promise any movement, gains, or profit for any trader or non-trader.
By viewing any material or using the information within this site, you agree that it is general educational material whether it is about learning trading online or not and you will not hold anybody responsible for loss or damages resulting from the content provided here. It doesn't matter if this website contain a materials related to any trading. Investing in financial product is subject to market risk. Financial products, such as stock, forex, commodity, and cryptocurrency, are known to be very speculative and any investment or something related in them should done carefully, desirably with a good personal risk management.
Prices movement in the past and past performance of certain traders are by no means an assurance of future performance or any stock, forex, commodity, or cryptocurrency market movement. This website is for informative and discussion purpose in this website only. Whether newbie in trading, part-time traders, or full time traders. No one here can makes no warranties or guarantees in respect of the content, whether it is about the trading or not. Discussion content reflects the views of individual people only. The website bears no responsibility for the accuracy of forum member’s comments whether about learning forex online or not and will bear no responsibility or legal liability for discussion postings.
Any tutorial, opinions and comments presented on this website do not represent the opinions on who should buy, sell or hold particular investments, stock, forex currency pairs, commodity, or any products or courses. Everyone should conduct their own independent research before making any decision.
The publications herein do not take into account the investment objectives, financial situation or particular needs of any particular person. You should obtain individual trading advice based on your own particular circumstances before making an investment decision on the basis of information about trading and other matter on this website.
As a user, you should agree, through acceptance of these terms and conditions, that you should not use this forum to post any content which is abusive, vulgar, hateful, and harassing to any traders and non-traders.
Tuyên bố từ chối trách nhiệm Mục đích của trang web này là một nơi để học hỏi và thảo luận. Trang web và mỗi chủ đề hướng dẫn không khuyến khích bất kỳ ai tham gia giao dịch hoặc đầu tư dưới bất kỳ hình thức nào. Bất kỳ thông tin nào được hiển thị trong bất kỳ phần nào của trang web này không hứa hẹn bất kỳ chuyển động, lợi nhuận hoặc lợi nhuận nào cho bất kỳ nhà kinh doanh hoặc không phải nhà kinh doanh nào.
Bằng cách xem bất kỳ tài liệu nào hoặc sử dụng thông tin trong trang web này, bạn đồng ý rằng đó là tài liệu giáo dục chung cho dù đó là về việc học giao dịch trực tuyến hay không và bạn sẽ không chịu bất kỳ ai chịu trách nhiệm về mất mát hoặc thiệt hại do nội dung được cung cấp ở đây. Không quan trọng nếu trang web này có chứa tài liệu liên quan đến bất kỳ giao dịch nào. Đầu tư vào sản phẩm tài chính phải chịu rủi ro thị trường. Các sản phẩm tài chính, chẳng hạn như chứng khoán, ngoại hối, hàng hóa và tiền điện tử, được biết là rất đầu cơ và bất kỳ khoản đầu tư nào hoặc thứ gì đó liên quan đến chúng đều phải được thực hiện cẩn thận, không cần thiết với việc quản lý rủi ro cá nhân tốt.
Chuyển động giá trong quá khứ và hiệu suất trong quá khứ của một số nhà giao dịch nhất định không có nghĩa là đảm bảo cho hoạt động trong tương lai hoặc bất kỳ chuyển động nào của thị trường chứng khoán, ngoại hối, hàng hóa hoặc tiền điện tử. Trang web này chỉ dành cho mục đích thông tin và thảo luận trong trang web này. Cho dù là người mới tham gia giao dịch, người giao dịch bán thời gian hay người giao dịch toàn thời gian. Không ai ở đây có thể không đảm bảo hoặc đảm bảo về nội dung, cho dù đó là về giao dịch hay không. Nội dung thảo luận chỉ phản ánh quan điểm của từng cá nhân. Trang web không chịu trách nhiệm về tính chính xác của các bình luận của thành viên diễn đàn về việc học ngoại hối trực tuyến hay không và sẽ không chịu trách nhiệm pháp lý hoặc trách nhiệm pháp lý đối với các bài đăng thảo luận.
Bất kỳ hướng dẫn, ý kiến và nhận xét nào được trình bày trên trang web này không đại diện cho ý kiến về việc ai nên mua, bán hoặc nắm giữ các khoản đầu tư cụ thể, chứng khoán, các cặp tiền tệ ngoại hối, hàng hóa, hoặc bất kỳ sản phẩm hoặc khóa học nào. Mọi người nên tiến hành nghiên cứu độc lập của riêng mình trước khi đưa ra bất kỳ quyết định nào.
Các ấn phẩm ở đây không tính đến mục tiêu đầu tư, tình hình tài chính hoặc nhu cầu cụ thể của bất kỳ cá nhân cụ thể nào. Bạn nên nhận lời khuyên giao dịch cá nhân dựa trên hoàn cảnh cụ thể của riêng bạn trước khi đưa ra quyết định đầu tư trên cơ sở thông tin về giao dịch và các vấn đề khác trên trang web này.
Với tư cách là người dùng, bạn nên đồng ý, thông qua việc chấp nhận các điều khoản và điều kiện này, rằng bạn không nên sử dụng diễn đàn này để đăng bất kỳ nội dung nào lạm dụng, thô tục, thù hận và quấy rối đối với bất kỳ thương nhân và những người không phải là thương nhân.
تنصل الغرض من هذا الموقع هو أن يكون مكانًا للتعلم والمناقشة. لا يشجع موقع الويب وكل موضوع تعليمي أي شخص على المشاركة في التداول أو الاستثمار من أي نوع. أي معلومات معروضة في أي جزء من هذا الموقع لا تعد بأي حركة أو مكاسب أو ربح لأي متداول أو غير متداول.
من خلال عرض أي مادة أو استخدام المعلومات الموجودة في هذا الموقع ، فإنك توافق على أنها مادة تعليمية عامة سواء كانت تتعلق بتعلم التداول عبر الإنترنت أم لا ، ولن تتحمل أي شخص المسؤولية عن الخسارة أو الأضرار الناتجة عن المحتوى المقدم هنا. لا يهم إذا كان هذا الموقع يحتوي على مواد متعلقة بأي تداول. الاستثمار في المنتجات المالية عرضة لمخاطر السوق. من المعروف أن المنتجات المالية ، مثل الأسهم والفوركس والسلع والعملات المشفرة ، مضاربة للغاية وأي استثمار أو شيء مرتبط بها يجب أن يتم بعناية ، ومن المرغوب فيه مع إدارة مخاطر شخصية جيدة.
حركة الأسعار في الماضي والأداء السابق لبعض المتداولين ليست بأي حال من الأحوال ضمانًا للأداء المستقبلي أو أي حركة في سوق الأسهم أو العملات الأجنبية أو السلع أو العملات المشفرة. هذا الموقع هو لغرض إعلامي ومناقشة في هذا الموقع فقط. سواء كان مبتدئًا في التداول ، أو متداولين بدوام جزئي ، أو متداولين بدوام كامل. لا يمكن لأي شخص هنا تقديم أي ضمانات أو ضمانات فيما يتعلق بالمحتوى ، سواء كان الأمر يتعلق بالتداول أم لا. يعكس محتوى المناقشة وجهات نظر الأفراد فقط. لا يتحمل موقع الويب أي مسؤولية عن دقة تعليقات أعضاء المنتدى سواء حول تعلم الفوركس عبر الإنترنت أم لا ، ولن يتحمل أي مسؤولية أو مسؤولية قانونية عن منشورات المناقشة.
لا يمثل أي برنامج تعليمي وآراء وتعليقات مقدمة على هذا الموقع الآراء حول من يجب عليه شراء أو بيع أو الاحتفاظ باستثمارات معينة أو أسهم أو أزواج عملات فوركس أو سلعة أو أي منتجات أو دورات تدريبية. يجب على الجميع إجراء أبحاثهم المستقلة قبل اتخاذ أي قرار.
لا تأخذ المنشورات الواردة هنا في الاعتبار أهداف الاستثمار أو الوضع المالي أو الاحتياجات الخاصة لأي شخص معين. يجب أن تحصل على مشورة تداول فردية بناءً على ظروفك الخاصة قبل اتخاذ قرار استثماري على أساس المعلومات المتعلقة بالتداول والأمور الأخرى على هذا الموقع.
بصفتك مستخدمًا ، يجب أن توافق ، من خلال قبول هذه الشروط والأحكام ، على عدم استخدام هذا المنتدى لنشر أي محتوى مسيء ومبتذل وكراهية ومضايقة لأي متداولين وغير متداولين.