
Discussion about Stock, Commodity and Forex Trading. For the blog, you can visit here.
关于股票、商品和外汇交易的讨论。您可以点击上方链接访问该博客。
مناقشة حول الأسهم والسلع وتداول العملات الأجنبية. يمكنكم زيارة المدونة عبر الرابط أعلاه.
Any information shown in any part of this website do not promise any movement, gains, or profit for any trader or non-trader.
It is reminded that each country has different set of rules, legality or culturally. Anyone should not take on what is in this forum or anywhere before consider the difference.
Please do not spam or post any illegal stuff in this Forum. All spammers will be completely banned. (Read terms)
Posted by FXOpen Trader
- Today at 11:53:26 AMMarket Insights with Gary Thomson: Where Are Oil, Gas & Global Indices Heading?
In this video, we'll explore the key economic events and market trends, shaping the financial landscape. Get ready for insights into financial markets to help you navigate the week ahead. Let's dive in!
In this episode of Market Insights, Gary Thomson looks at the key themes traders may monitor in the coming days. Recent developments in energy markets and rising volatility across global equity indices may play an important role in shaping market sentiment in the week ahead.
Key topics covered in this episode:
- Energy Markets
Energy markets remain highly sensitive to the US–Iran conflict, as disruptions in the Strait of Hormuz push oil prices higher and raise concerns about global supply. Even after the IEA's record oil release, traders remain skeptical that it will fully offset potential supply shortages. Natural gas markets in Europe and Asia have also surged due to fears over LNG flows from the Gulf region. If disruptions in the Strait of Hormuz persist, could energy prices rise further?
- Global Stock Indices
Global equity markets have become highly volatile after the escalation of the US–Iran conflict, as investors moved away from risk assets. Major indices such as the KOSPI, Nikkei 225, and Euro Stoxx 50 posted sharp declines, reflecting rising geopolitical uncertainty and concerns about higher energy prices. Will geopolitical tensions and rising energy costs continue to pressure global stock markets in the coming days?
In summary, traders will focus on two main themes during the week ahead: developments in oil and natural gas markets and volatility across global equity indices.
Gain insights to strengthen your trading knowledge.

Watch it now and stay updated with FXOpen.
Don't miss out on this invaluable opportunity to sharpen your trading skills and make informed decisions.
Disclaimer: This video represents the opinion of the Companies operating under the FXOpen brand only. It is not to be construed as an offer, solicitation, or recommendation with respect to products and services provided by the Companies operating under the FXOpen brand, nor is it to be considered financial advice.
In this video, we'll explore the key economic events and market trends, shaping the financial landscape. Get ready for insights into financial markets to help you navigate the week ahead. Let's dive in!
In this episode of Market Insights, Gary Thomson looks at the key themes traders may monitor in the coming days. Recent developments in energy markets and rising volatility across global equity indices may play an important role in shaping market sentiment in the week ahead.
Key topics covered in this episode:
- Energy Markets
Energy markets remain highly sensitive to the US–Iran conflict, as disruptions in the Strait of Hormuz push oil prices higher and raise concerns about global supply. Even after the IEA's record oil release, traders remain skeptical that it will fully offset potential supply shortages. Natural gas markets in Europe and Asia have also surged due to fears over LNG flows from the Gulf region. If disruptions in the Strait of Hormuz persist, could energy prices rise further?
- Global Stock Indices
Global equity markets have become highly volatile after the escalation of the US–Iran conflict, as investors moved away from risk assets. Major indices such as the KOSPI, Nikkei 225, and Euro Stoxx 50 posted sharp declines, reflecting rising geopolitical uncertainty and concerns about higher energy prices. Will geopolitical tensions and rising energy costs continue to pressure global stock markets in the coming days?
In summary, traders will focus on two main themes during the week ahead: developments in oil and natural gas markets and volatility across global equity indices.
Gain insights to strengthen your trading knowledge.
Watch it now and stay updated with FXOpen.
Don't miss out on this invaluable opportunity to sharpen your trading skills and make informed decisions.
Disclaimer: This video represents the opinion of the Companies operating under the FXOpen brand only. It is not to be construed as an offer, solicitation, or recommendation with respect to products and services provided by the Companies operating under the FXOpen brand, nor is it to be considered financial advice.
Posted by FXOpen Trader
- Today at 11:49:13 AMNetflix (NFLX) Shares Pull Back After a 30% Surge

On 21 January, while analysing the NFLX chart, we:
→ identified a descending channel and a resistance zone around the $100 level;
→ noted that Netflix shares were showing a sustained downtrend. Selling pressure had been triggered primarily by reports of a potential acquisition of Warner Bros. Discovery assets, with the market concerned that Netflix might take on multi‑billion-dollar debt and face intense antitrust scrutiny.
Since then, the situation has shifted markedly. After reaching the lower boundary of the channel near $75, the stock reversed higher, following Netflix's official announcement that it was walking away from the deal, opting to preserve capital rather than pursue a risky expansion. This sparked a strong relief rally: NFLX shares gapped up significantly and moved into the upper half of the channel.
Further bullish momentum was driven by analyst upgrades, with target prices revised upwards, suggesting a potential transition into a new uptrend.

TO VIEW THE FULL ANALYSIS, VISIT FXOPEN BLOG
Disclaimer: This article represents the opinion of the Companies operating under the FXOpen brand only (excluding FXOpen EU). It is not to be construed as an offer, solicitation, or recommendation with respect to products and services provided by the Companies operating under the FXOpen brand, nor is it to be considered financial advice.
On 21 January, while analysing the NFLX chart, we:
→ identified a descending channel and a resistance zone around the $100 level;
→ noted that Netflix shares were showing a sustained downtrend. Selling pressure had been triggered primarily by reports of a potential acquisition of Warner Bros. Discovery assets, with the market concerned that Netflix might take on multi‑billion-dollar debt and face intense antitrust scrutiny.
Since then, the situation has shifted markedly. After reaching the lower boundary of the channel near $75, the stock reversed higher, following Netflix's official announcement that it was walking away from the deal, opting to preserve capital rather than pursue a risky expansion. This sparked a strong relief rally: NFLX shares gapped up significantly and moved into the upper half of the channel.
Further bullish momentum was driven by analyst upgrades, with target prices revised upwards, suggesting a potential transition into a new uptrend.
TO VIEW THE FULL ANALYSIS, VISIT FXOPEN BLOG
Disclaimer: This article represents the opinion of the Companies operating under the FXOpen brand only (excluding FXOpen EU). It is not to be construed as an offer, solicitation, or recommendation with respect to products and services provided by the Companies operating under the FXOpen brand, nor is it to be considered financial advice.
Posted by FXOpen Trader
- Today at 11:45:28 AMUS Dollar Index (DXY) Rises Above the 100 Level

Today the US Dollar Index (DXY) climbed above the psychological 100 mark for the first time in 2026, supported by a tense fundamental backdrop, with the military conflict in the Middle East acting as the main driver.
→ Financial market participants are selling riskier assets (such as equities and emerging market currencies) and reallocating funds into the US dollar, which is traditionally viewed as a safe haven during periods of war.
→ Iran's statements about potentially closing the Strait of Hormuz, along with strikes on fuel infrastructure, are driving oil prices higher and increasing global inflation risks.
→ The strength of the US economy is also supporting the dollar. Yesterday's labour market data showed no increase in unemployment.

TO VIEW THE FULL ANALYSIS, VISIT FXOPEN BLOG
Disclaimer: This article represents the opinion of the Companies operating under the FXOpen brand only (excluding FXOpen EU). It is not to be construed as an offer, solicitation, or recommendation with respect to products and services provided by the Companies operating under the FXOpen brand, nor is it to be considered financial advice.
Today the US Dollar Index (DXY) climbed above the psychological 100 mark for the first time in 2026, supported by a tense fundamental backdrop, with the military conflict in the Middle East acting as the main driver.
→ Financial market participants are selling riskier assets (such as equities and emerging market currencies) and reallocating funds into the US dollar, which is traditionally viewed as a safe haven during periods of war.
→ Iran's statements about potentially closing the Strait of Hormuz, along with strikes on fuel infrastructure, are driving oil prices higher and increasing global inflation risks.
→ The strength of the US economy is also supporting the dollar. Yesterday's labour market data showed no increase in unemployment.
TO VIEW THE FULL ANALYSIS, VISIT FXOPEN BLOG
Disclaimer: This article represents the opinion of the Companies operating under the FXOpen brand only (excluding FXOpen EU). It is not to be construed as an offer, solicitation, or recommendation with respect to products and services provided by the Companies operating under the FXOpen brand, nor is it to be considered financial advice.
Posted by FXOpen Trader
- Today at 08:39:04 AMUSD/JPY and USD/CAD Continue to Rise Ahead of Key Data Releases

The US dollar continues to strengthen against major counterparts as markets await important macroeconomic data scheduled for release in the coming hours. Investors are focusing on US GDP figures, the Personal Consumption Expenditures (PCE) price index, and Canada's labour market statistics. These releases could significantly influence expectations regarding the future policy path of the Federal Reserve and set the tone for currency market movements.
The strengthening of the US currency has also been supported by rising geopolitical tensions in the Middle East. Over the past 24 hours, the conflict involving Iran, the US, and Israel has intensified, leading to a sharp rise in oil prices and increased demand for safe-haven assets. Reports indicate strikes on tankers in the region, along with conflicting information about the potential closure of the Strait of Hormuz. Rising energy prices and heightened geopolitical risks are supporting the dollar as demand for liquid defensive assets increases. At the same time, market participants remain cautious ahead of key data releases that could alter expectations for interest rates.

TO VIEW THE FULL ANALYSIS, VISIT FXOPEN BLOG
Disclaimer: This article represents the opinion of the Companies operating under the FXOpen brand only (excluding FXOpen EU). It is not to be construed as an offer, solicitation, or recommendation with respect to products and services provided by the Companies operating under the FXOpen brand, nor is it to be considered financial advice.
The US dollar continues to strengthen against major counterparts as markets await important macroeconomic data scheduled for release in the coming hours. Investors are focusing on US GDP figures, the Personal Consumption Expenditures (PCE) price index, and Canada's labour market statistics. These releases could significantly influence expectations regarding the future policy path of the Federal Reserve and set the tone for currency market movements.
The strengthening of the US currency has also been supported by rising geopolitical tensions in the Middle East. Over the past 24 hours, the conflict involving Iran, the US, and Israel has intensified, leading to a sharp rise in oil prices and increased demand for safe-haven assets. Reports indicate strikes on tankers in the region, along with conflicting information about the potential closure of the Strait of Hormuz. Rising energy prices and heightened geopolitical risks are supporting the dollar as demand for liquid defensive assets increases. At the same time, market participants remain cautious ahead of key data releases that could alter expectations for interest rates.
TO VIEW THE FULL ANALYSIS, VISIT FXOPEN BLOG
Disclaimer: This article represents the opinion of the Companies operating under the FXOpen brand only (excluding FXOpen EU). It is not to be construed as an offer, solicitation, or recommendation with respect to products and services provided by the Companies operating under the FXOpen brand, nor is it to be considered financial advice.
Posted by FXOpen Trader
- March 12, 2026, 12:14:09 PMOracle (ORCL) Shares Jump Above $160

Following a strong earnings report, Oracle shares surged above $160, marking roughly a 1.5-month high:
→ Earnings per share: expected $1.70, actual $1.79;
→ Revenue: expected $16.7bn, actual $17.2bn.
This is the first quarter in 15 years in which both revenue and earnings rose by more than 20%. Additional optimism came from:
→ Cloud infrastructure revenue, which jumped 84% to $4.9bn;
→ Oracle confirming a five-year, $300bn deal with OpenAI (Project Stargate);
→ Total backlog (future revenue) surpassing $553bn.

These developments have the potential to significantly ease downward pressure on ORCL shares, which had been in a downtrend following a record high last autumn.
TO VIEW THE FULL ANALYSIS, VISIT FXOPEN BLOG
Disclaimer: This article represents the opinion of the Companies operating under the FXOpen brand only (excluding FXOpen EU). It is not to be construed as an offer, solicitation, or recommendation with respect to products and services provided by the Companies operating under the FXOpen brand, nor is it to be considered financial advice.
Following a strong earnings report, Oracle shares surged above $160, marking roughly a 1.5-month high:
→ Earnings per share: expected $1.70, actual $1.79;
→ Revenue: expected $16.7bn, actual $17.2bn.
This is the first quarter in 15 years in which both revenue and earnings rose by more than 20%. Additional optimism came from:
→ Cloud infrastructure revenue, which jumped 84% to $4.9bn;
→ Oracle confirming a five-year, $300bn deal with OpenAI (Project Stargate);
→ Total backlog (future revenue) surpassing $553bn.
These developments have the potential to significantly ease downward pressure on ORCL shares, which had been in a downtrend following a record high last autumn.
TO VIEW THE FULL ANALYSIS, VISIT FXOPEN BLOG
Disclaimer: This article represents the opinion of the Companies operating under the FXOpen brand only (excluding FXOpen EU). It is not to be construed as an offer, solicitation, or recommendation with respect to products and services provided by the Companies operating under the FXOpen brand, nor is it to be considered financial advice.
Posted by FXOpen Trader
- March 12, 2026, 11:44:48 AMUSD/JPY Approaches Key Resistance Level

The USD/JPY chart shows a bullish trend at the start of March, influenced by the escalation of military activity in the Middle East.
On one hand, the US dollar is strengthening due to increased demand for safe-haven assets. On the other, the Japanese economy is under pressure because of its heavy reliance on oil imports from the Middle East.
These factors have pushed the pair above 159.20 JPY per USD this week, surpassing the January high (point A). The 2026 peak lies nearby; however, technical analysis suggests that bullish momentum may be fading.

TO VIEW THE FULL ANALYSIS, VISIT FXOPEN BLOG
Disclaimer: This article represents the opinion of the Companies operating under the FXOpen brand only (excluding FXOpen EU). It is not to be construed as an offer, solicitation, or recommendation with respect to products and services provided by the Companies operating under the FXOpen brand, nor is it to be considered financial advice.
The USD/JPY chart shows a bullish trend at the start of March, influenced by the escalation of military activity in the Middle East.
On one hand, the US dollar is strengthening due to increased demand for safe-haven assets. On the other, the Japanese economy is under pressure because of its heavy reliance on oil imports from the Middle East.
These factors have pushed the pair above 159.20 JPY per USD this week, surpassing the January high (point A). The 2026 peak lies nearby; however, technical analysis suggests that bullish momentum may be fading.
TO VIEW THE FULL ANALYSIS, VISIT FXOPEN BLOG
Disclaimer: This article represents the opinion of the Companies operating under the FXOpen brand only (excluding FXOpen EU). It is not to be construed as an offer, solicitation, or recommendation with respect to products and services provided by the Companies operating under the FXOpen brand, nor is it to be considered financial advice.
Posted by FXOpen Trader
- March 11, 2026, 01:09:10 PMMarket Analysis: EUR/USD Reclaims Ground While USD/JPY Momentum Fades

EUR/USD is recovering losses from 1.1500. USD/JPY is correcting gains from 159.00 and might decline further if it stays below 158.30.
Important Takeaways for EUR/USD and USD/JPY Analysis Today
- The Euro struggled to stay in a positive zone and declined below 1.1700 before finding support.
- There was a break above a connecting bearish trend line with resistance at 1.1580 on the hourly chart of EUR/USD at FXOpen.
- USD/JPY started a decent increase above 157.00 before the bears appeared near 158.90.
- There is a key contracting triangle forming with resistance near 158.30 on the hourly chart at FXOpen.
EUR/USD Technical Analysis

On the hourly chart of EUR/USD at FXOpen, the pair started a fresh decline from 1.1825. The pair broke below 1.1665 and the 50-hour simple moving average. Finally, it tested the 1.1500 zone. A low was formed at 1.1507, and the pair is now recovering losses.
There was a move above 1.1550 and a connecting bearish trend line at 1.1580. The pair surpassed the 38.2% Fib retracement level of the downward move from the 1.1826 swing high to the 1.1507 low. On the upside, the pair is now facing resistance near the 50% Fib retracement at 1.1665.
The first major hurdle for the bulls could be 1.1705. A break above 1.1705 could set the pace for another increase. In the stated case, the pair might rise toward 1.1775.
If not, the pair might drop again. Immediate support is near the 50-hour simple moving average and 1.1620. The next key area of interest might be 1.1565. If there is a downside break below 1.1565, the pair could drop towards 1.1505. The main target for the bears on the EUR/USD chart could be 1.1440, below which the pair could start a major decline.
TO VIEW THE FULL ANALYSIS, VISIT FXOPEN BLOG
Disclaimer: This article represents the opinion of the Companies operating under the FXOpen brand only (excluding FXOpen EU). It is not to be construed as an offer, solicitation, or recommendation with respect to products and services provided by the Companies operating under the FXOpen brand, nor is it to be considered financial advice.
EUR/USD is recovering losses from 1.1500. USD/JPY is correcting gains from 159.00 and might decline further if it stays below 158.30.
Important Takeaways for EUR/USD and USD/JPY Analysis Today
- The Euro struggled to stay in a positive zone and declined below 1.1700 before finding support.
- There was a break above a connecting bearish trend line with resistance at 1.1580 on the hourly chart of EUR/USD at FXOpen.
- USD/JPY started a decent increase above 157.00 before the bears appeared near 158.90.
- There is a key contracting triangle forming with resistance near 158.30 on the hourly chart at FXOpen.
EUR/USD Technical Analysis
On the hourly chart of EUR/USD at FXOpen, the pair started a fresh decline from 1.1825. The pair broke below 1.1665 and the 50-hour simple moving average. Finally, it tested the 1.1500 zone. A low was formed at 1.1507, and the pair is now recovering losses.
There was a move above 1.1550 and a connecting bearish trend line at 1.1580. The pair surpassed the 38.2% Fib retracement level of the downward move from the 1.1826 swing high to the 1.1507 low. On the upside, the pair is now facing resistance near the 50% Fib retracement at 1.1665.
The first major hurdle for the bulls could be 1.1705. A break above 1.1705 could set the pace for another increase. In the stated case, the pair might rise toward 1.1775.
If not, the pair might drop again. Immediate support is near the 50-hour simple moving average and 1.1620. The next key area of interest might be 1.1565. If there is a downside break below 1.1565, the pair could drop towards 1.1505. The main target for the bears on the EUR/USD chart could be 1.1440, below which the pair could start a major decline.
TO VIEW THE FULL ANALYSIS, VISIT FXOPEN BLOG
Disclaimer: This article represents the opinion of the Companies operating under the FXOpen brand only (excluding FXOpen EU). It is not to be construed as an offer, solicitation, or recommendation with respect to products and services provided by the Companies operating under the FXOpen brand, nor is it to be considered financial advice.
Posted by FXOpen Trader
- March 11, 2026, 09:35:40 AMS&P 500 Fluctuates Ahead of CPI Report

As the S&P 500 chart (US SPX 500 mini on FXOpen) shows, the index is trading near the 6,800 level this morning. However, the balance between supply and demand could change significantly after the release of the Consumer Price Index (CPI) report scheduled for 15:30 GMT+3.
Against the backdrop of military developments in the Middle East and sharp movements in oil prices (as we previously noted, the WTI market remains volatile), today's data will be an important factor for traders assessing the future policy path of the Federal Reserve. According to Forex Factory, analysts expect headline inflation to remain at 2.4%.

TO VIEW THE FULL ANALYSIS, VISIT FXOPEN BLOG
Disclaimer: This article represents the opinion of the Companies operating under the FXOpen brand only (excluding FXOpen EU). It is not to be construed as an offer, solicitation, or recommendation with respect to products and services provided by the Companies operating under the FXOpen brand, nor is it to be considered financial advice.
As the S&P 500 chart (US SPX 500 mini on FXOpen) shows, the index is trading near the 6,800 level this morning. However, the balance between supply and demand could change significantly after the release of the Consumer Price Index (CPI) report scheduled for 15:30 GMT+3.
Against the backdrop of military developments in the Middle East and sharp movements in oil prices (as we previously noted, the WTI market remains volatile), today's data will be an important factor for traders assessing the future policy path of the Federal Reserve. According to Forex Factory, analysts expect headline inflation to remain at 2.4%.
TO VIEW THE FULL ANALYSIS, VISIT FXOPEN BLOG
Disclaimer: This article represents the opinion of the Companies operating under the FXOpen brand only (excluding FXOpen EU). It is not to be construed as an offer, solicitation, or recommendation with respect to products and services provided by the Companies operating under the FXOpen brand, nor is it to be considered financial advice.
Posted by FXOpen Trader
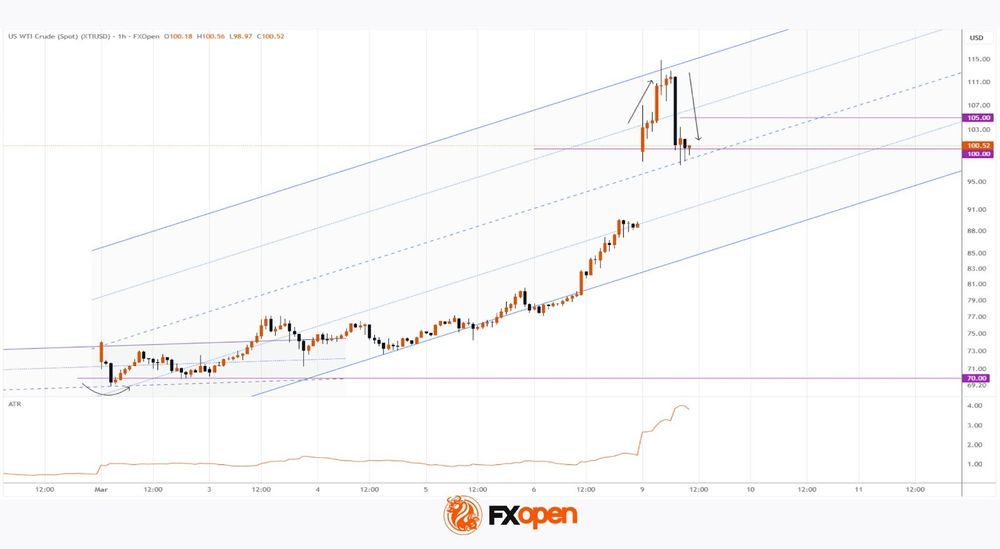
- March 11, 2026, 09:28:09 AMXTI/USD Chart Analysis: Oil Prices Remain Volatile

Against the backdrop of military developments in the Middle East, the situation in the oil market is evolving rapidly. Only two days have passed since 9 March, when we published a morning analytical note in which we:
→ highlighted the rise of XTI/USD above $100 and a sharp spike in volatility (as reflected by the ATR indicator);
→ outlined an ascending channel and pointed to signs of a bearish engulfing pattern, suggesting that sellers were gaining the initiative.
Subsequent price action in the following hours confirmed that selling pressure was strong enough to break below the lower boundary of the channel later that same day. This occurred amid statements from President Trump, and a wide bearish candle formed on the XTI/USD chart.
On 10 March, the former lower boundary of the channel (marked by red arrows) acted as resistance while traders closely monitored developments around the Strait of Hormuz. According to The Wall Street Journal, the International Energy Agency proposed the largest oil reserve release in its history, which added another bearish factor for the market.

TO VIEW THE FULL ANALYSIS, VISIT FXOPEN BLOG
Disclaimer: This article represents the opinion of the Companies operating under the FXOpen brand only (excluding FXOpen EU). It is not to be construed as an offer, solicitation, or recommendation with respect to products and services provided by the Companies operating under the FXOpen brand, nor is it to be considered financial advice.
Against the backdrop of military developments in the Middle East, the situation in the oil market is evolving rapidly. Only two days have passed since 9 March, when we published a morning analytical note in which we:
→ highlighted the rise of XTI/USD above $100 and a sharp spike in volatility (as reflected by the ATR indicator);
→ outlined an ascending channel and pointed to signs of a bearish engulfing pattern, suggesting that sellers were gaining the initiative.
Subsequent price action in the following hours confirmed that selling pressure was strong enough to break below the lower boundary of the channel later that same day. This occurred amid statements from President Trump, and a wide bearish candle formed on the XTI/USD chart.
On 10 March, the former lower boundary of the channel (marked by red arrows) acted as resistance while traders closely monitored developments around the Strait of Hormuz. According to The Wall Street Journal, the International Energy Agency proposed the largest oil reserve release in its history, which added another bearish factor for the market.
TO VIEW THE FULL ANALYSIS, VISIT FXOPEN BLOG
Disclaimer: This article represents the opinion of the Companies operating under the FXOpen brand only (excluding FXOpen EU). It is not to be construed as an offer, solicitation, or recommendation with respect to products and services provided by the Companies operating under the FXOpen brand, nor is it to be considered financial advice.
Posted by FXOpen Trader
- March 11, 2026, 09:16:07 AMEuro Recovers Early-Week Losses Ahead of Key Inflation Data

The euro is strengthening after declining earlier in the week. During the first trading sessions the single currency remained under pressure, but was later followed by a sharp rebound. The recovery was supported by easing geopolitical tensions in the Middle East, where signs have emerged of a slowdown in the escalation surrounding Iran. The reduction in geopolitical risks has weakened demand for safe-haven assets and allowed European currencies to partially recover their losses.
At the same time, market participants remain cautious as important inflation figures from both the eurozone and the United States are due to be released soon.
Inflation data remain a key factor shaping expectations for the future policy path of central banks. Higher inflation in the US could strengthen the dollar by reinforcing expectations that the Federal Reserve will maintain a tight monetary policy stance. Meanwhile, accelerating inflation in Europe could support the euro, as it would strengthen arguments for the European Central Bank to keep interest rates elevated for a longer period.
Overall, the current movement in major euro pairs appears largely corrective, while the next directional move will likely depend on the upcoming macroeconomic releases.

TO VIEW THE FULL ANALYSIS, VISIT FXOPEN BLOG
Disclaimer: This article represents the opinion of the Companies operating under the FXOpen brand only (excluding FXOpen EU). It is not to be construed as an offer, solicitation, or recommendation with respect to products and services provided by the Companies operating under the FXOpen brand, nor is it to be considered financial advice.
The euro is strengthening after declining earlier in the week. During the first trading sessions the single currency remained under pressure, but was later followed by a sharp rebound. The recovery was supported by easing geopolitical tensions in the Middle East, where signs have emerged of a slowdown in the escalation surrounding Iran. The reduction in geopolitical risks has weakened demand for safe-haven assets and allowed European currencies to partially recover their losses.
At the same time, market participants remain cautious as important inflation figures from both the eurozone and the United States are due to be released soon.
Inflation data remain a key factor shaping expectations for the future policy path of central banks. Higher inflation in the US could strengthen the dollar by reinforcing expectations that the Federal Reserve will maintain a tight monetary policy stance. Meanwhile, accelerating inflation in Europe could support the euro, as it would strengthen arguments for the European Central Bank to keep interest rates elevated for a longer period.
Overall, the current movement in major euro pairs appears largely corrective, while the next directional move will likely depend on the upcoming macroeconomic releases.
TO VIEW THE FULL ANALYSIS, VISIT FXOPEN BLOG
Disclaimer: This article represents the opinion of the Companies operating under the FXOpen brand only (excluding FXOpen EU). It is not to be construed as an offer, solicitation, or recommendation with respect to products and services provided by the Companies operating under the FXOpen brand, nor is it to be considered financial advice.
Posted by FXOpen Trader
- March 10, 2026, 10:01:27 AMGold Price Holds Near Key Support

As the XAU/USD chart shows, the gold price has been holding within the $5,060–$5,200 range over the past several sessions.
Bullish view: the key support is the lower boundary of the long-term channel that has been in place since the beginning of 2026.
Bearish view: pressure on the price comes from statements by President Trump suggesting that the conflict in the Middle East could end soon. Yesterday, the US president described the operation in Iran as a "small incursion" and a "short-term" measure, which helped ease geopolitical risks and reduce demand for gold as a safe-haven asset.

TO VIEW THE FULL ANALYSIS, VISIT FXOPEN BLOG
Disclaimer: This article represents the opinion of the Companies operating under the FXOpen brand only (excluding FXOpen EU). It is not to be construed as an offer, solicitation, or recommendation with respect to products and services provided by the Companies operating under the FXOpen brand, nor is it to be considered financial advice.
As the XAU/USD chart shows, the gold price has been holding within the $5,060–$5,200 range over the past several sessions.
Bullish view: the key support is the lower boundary of the long-term channel that has been in place since the beginning of 2026.
Bearish view: pressure on the price comes from statements by President Trump suggesting that the conflict in the Middle East could end soon. Yesterday, the US president described the operation in Iran as a "small incursion" and a "short-term" measure, which helped ease geopolitical risks and reduce demand for gold as a safe-haven asset.
TO VIEW THE FULL ANALYSIS, VISIT FXOPEN BLOG
Disclaimer: This article represents the opinion of the Companies operating under the FXOpen brand only (excluding FXOpen EU). It is not to be construed as an offer, solicitation, or recommendation with respect to products and services provided by the Companies operating under the FXOpen brand, nor is it to be considered financial advice.
Posted by FXOpen Trader
- March 10, 2026, 09:51:06 AMEUR/USD Chart Analysis: Pair Rebounds from the Year's Low

Analysing the EUR/USD chart five days ago, we:
→ constructed a downward channel, noting signs that the bears remained in control;
→ outlined a scenario in which the rate would decline to a new yearly low (and test the lower boundary of the channel).
Yesterday's price action confirmed these assumptions – the low at H is below the low of 3 February (F), refining the lower boundary of the channel. At the same time, the sharp upward reversal (shown by the arrow) indicates increasing demand, driven by a shift in sentiment due to several factors, including:
→ Trump's speech, in which the president stated that the war in Iran is progressing successfully and that he has contingency plans for any scenario. This cooled demand for the USD as a safe-haven asset.
→ Expectations of US inflation data scheduled for release tomorrow.

TO VIEW THE FULL ANALYSIS, VISIT FXOPEN BLOG
Disclaimer: This article represents the opinion of the Companies operating under the FXOpen brand only (excluding FXOpen EU). It is not to be construed as an offer, solicitation, or recommendation with respect to products and services provided by the Companies operating under the FXOpen brand, nor is it to be considered financial advice.
Analysing the EUR/USD chart five days ago, we:
→ constructed a downward channel, noting signs that the bears remained in control;
→ outlined a scenario in which the rate would decline to a new yearly low (and test the lower boundary of the channel).
Yesterday's price action confirmed these assumptions – the low at H is below the low of 3 February (F), refining the lower boundary of the channel. At the same time, the sharp upward reversal (shown by the arrow) indicates increasing demand, driven by a shift in sentiment due to several factors, including:
→ Trump's speech, in which the president stated that the war in Iran is progressing successfully and that he has contingency plans for any scenario. This cooled demand for the USD as a safe-haven asset.
→ Expectations of US inflation data scheduled for release tomorrow.
TO VIEW THE FULL ANALYSIS, VISIT FXOPEN BLOG
Disclaimer: This article represents the opinion of the Companies operating under the FXOpen brand only (excluding FXOpen EU). It is not to be construed as an offer, solicitation, or recommendation with respect to products and services provided by the Companies operating under the FXOpen brand, nor is it to be considered financial advice.
Posted by FXOpen Trader
- March 10, 2026, 09:45:20 AMFair Value Gaps (FVGs) and Liquidity Voids – Differences & Strategies

Fair value gaps (FVGs) and liquidity voids highlight moments when price moves aggressively due to order imbalances. While they are closely related within the Smart Money Concept (SMC) framework, they differ in scale, structure, and trading application. This article explains how each forms, how they interact, and how traders may incorporate them into a structured market analysis approach.
TO VIEW THE FULL ANALYSIS, VISIT FXOPEN BLOG
Disclaimer: This article represents the opinion of the Companies operating under the FXOpen brand only (excluding FXOpen EU). It is not to be construed as an offer, solicitation, or recommendation with respect to products and services provided by the Companies operating under the FXOpen brand, nor is it to be considered financial advice.
Posted by FXOpen Trader
- March 09, 2026, 12:42:53 PMDollar Index (DXY) Hits Yearly High

Today, the dollar index rose above last week's peak around the 99.68 level, setting a new high for 2026. This movement is supported by a tense fundamental backdrop:
→ Inflationary pressures from rising oil prices. Markets may be pricing in a "higher for longer" scenario, with elevated Fed rates persisting.
→ Safe-haven demand. Escalation in the Middle East—including strikes on Iran and the rise of hardline leader Mojtaba Khamenei in Tehran—may push market participants towards defensive strategies and the US dollar.
→ Weakness in other currencies. The Middle East conflict can weigh on the yen and euro, as European and Japanese economies remain highly sensitive to energy prices.

TO VIEW THE FULL ANALYSIS, VISIT FXOPEN BLOG
Disclaimer: This article represents the opinion of the Companies operating under the FXOpen brand only (excluding FXOpen EU). It is not to be construed as an offer, solicitation, or recommendation with respect to products and services provided by the Companies operating under the FXOpen brand, nor is it to be considered financial advice.
Today, the dollar index rose above last week's peak around the 99.68 level, setting a new high for 2026. This movement is supported by a tense fundamental backdrop:
→ Inflationary pressures from rising oil prices. Markets may be pricing in a "higher for longer" scenario, with elevated Fed rates persisting.
→ Safe-haven demand. Escalation in the Middle East—including strikes on Iran and the rise of hardline leader Mojtaba Khamenei in Tehran—may push market participants towards defensive strategies and the US dollar.
→ Weakness in other currencies. The Middle East conflict can weigh on the yen and euro, as European and Japanese economies remain highly sensitive to energy prices.
TO VIEW THE FULL ANALYSIS, VISIT FXOPEN BLOG
Disclaimer: This article represents the opinion of the Companies operating under the FXOpen brand only (excluding FXOpen EU). It is not to be construed as an offer, solicitation, or recommendation with respect to products and services provided by the Companies operating under the FXOpen brand, nor is it to be considered financial advice.
Posted by FXOpen Trader
- March 09, 2026, 12:31:13 PMWTI Oil Price Rises Above $100

Another shocking Monday for the energy market. Last week's start was remembered for a bullish gap of more than 10% (which was later followed by a pullback), but today's market open proved even more volatile (as reflected by the ATR indicator). After a bullish gap of roughly 11%, the price continued to climb, reaching a peak of around $114 per barrel of WTI during the Asian session. This is the highest price since 2022.
The drivers of the rally are obvious – the escalation of the war in the Middle East, with more countries becoming involved. Risks have reached a critical point, with discussions emerging around the scenario of a complete blockade of shipping through the Strait of Hormuz. In such a case, oil-producing countries could invoke force majeure as grounds for halting supplies.
TO VIEW THE FULL ANALYSIS, VISIT FXOPEN BLOG
Disclaimer: This article represents the opinion of the Companies operating under the FXOpen brand only (excluding FXOpen EU). It is not to be construed as an offer, solicitation, or recommendation with respect to products and services provided by the Companies operating under the FXOpen brand, nor is it to be considered financial advice.


-
Discussion Forum / 论坛 / منتدى للنقاش/ Diễn đàn thảo luận
- Privacy Policy -.
Disclaimer : The purpose of this website is to be a place for learning and discussion. The website and each tutorial topics do not encourage anyone to participate in trading or investment of any kind. Any information shown in any part of this website do not promise any movement, gains, or profit for any trader or non-trader.
By viewing any material or using the information within this site, you agree that it is general educational material whether it is about learning trading online or not and you will not hold anybody responsible for loss or damages resulting from the content provided here. It doesn't matter if this website contain a materials related to any trading. Investing in financial product is subject to market risk. Financial products, such as stock, forex, commodity, and cryptocurrency, are known to be very speculative and any investment or something related in them should done carefully, desirably with a good personal risk management.
Prices movement in the past and past performance of certain traders are by no means an assurance of future performance or any stock, forex, commodity, or cryptocurrency market movement. This website is for informative and discussion purpose in this website only. Whether newbie in trading, part-time traders, or full time traders. No one here can makes no warranties or guarantees in respect of the content, whether it is about the trading or not. Discussion content reflects the views of individual people only. The website bears no responsibility for the accuracy of forum member’s comments whether about learning forex online or not and will bear no responsibility or legal liability for discussion postings.
Any tutorial, opinions and comments presented on this website do not represent the opinions on who should buy, sell or hold particular investments, stock, forex currency pairs, commodity, or any products or courses. Everyone should conduct their own independent research before making any decision.
The publications herein do not take into account the investment objectives, financial situation or particular needs of any particular person. You should obtain individual trading advice based on your own particular circumstances before making an investment decision on the basis of information about trading and other matter on this website.
As a user, you should agree, through acceptance of these terms and conditions, that you should not use this forum to post any content which is abusive, vulgar, hateful, and harassing to any traders and non-traders.