The purpose of this website is to be a place for learning and discussion. The website and each tutorial topics do not encourage anyone to participate in trading or investment of any kind. Any information shown in any part of this website do not promise any movement, gains, or profit for any trader or non-trader.
How I trade? For example, In an uptrend trend line, When the price breaks out the trend line, after 60 pips, I buy. I put 50 pips TP and put the SL, 40 pips in below of the 161.80% of the Fibonacci. The SL is big but I have to put a big SL. And it profits about 95%. If the price touched the 161.80% of the Fibonacci, I buy again. I put the TP on the first TP and put the SL, 40 pips in below of the 261.80% of the Fibonacci. Sometimes 161.80% of the Fibonacci is near to the break point. In these cases, I consider the 261.80% instead of the 161.80%. Work in the H4 time frame.
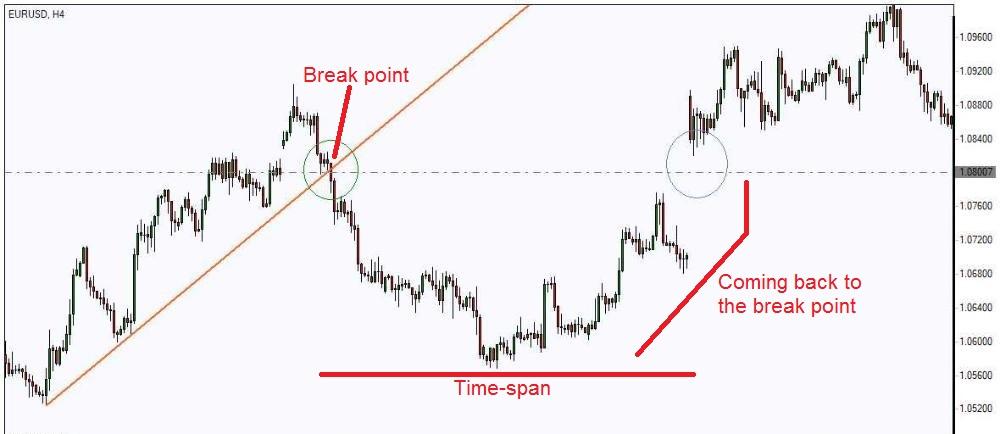
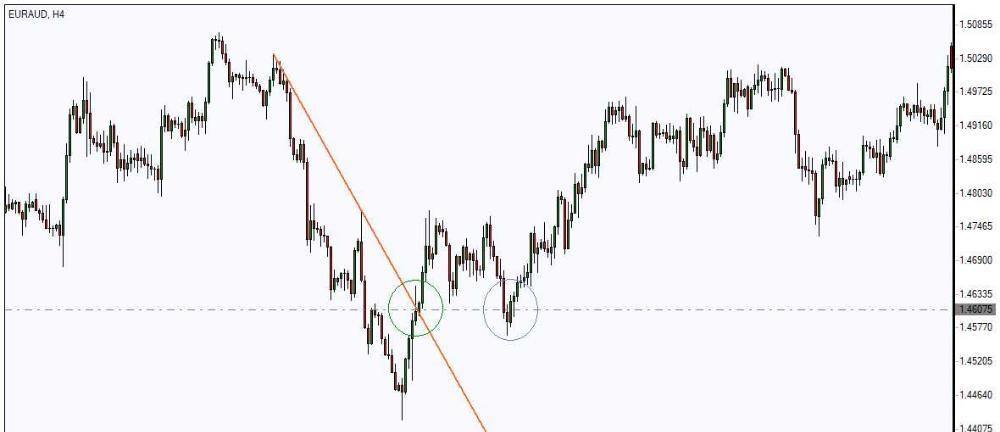
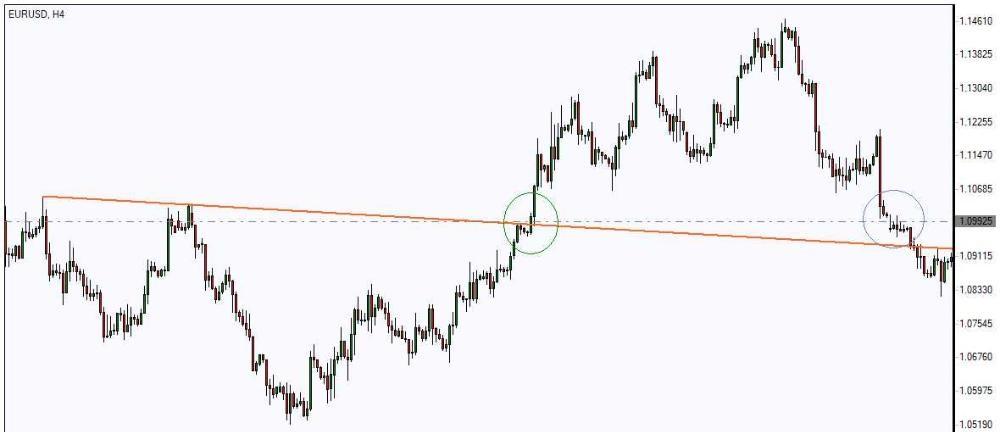
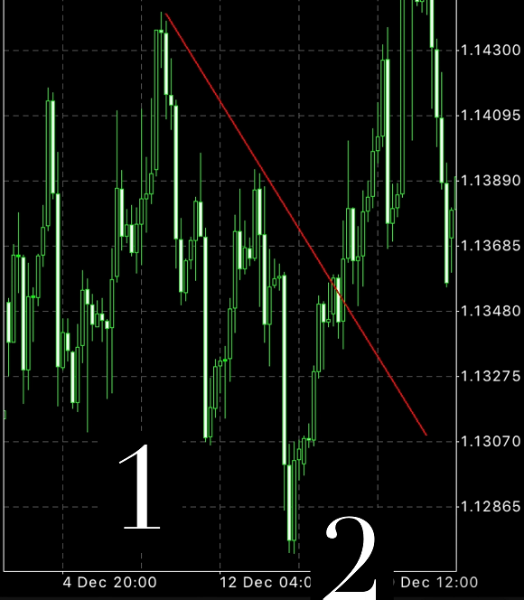
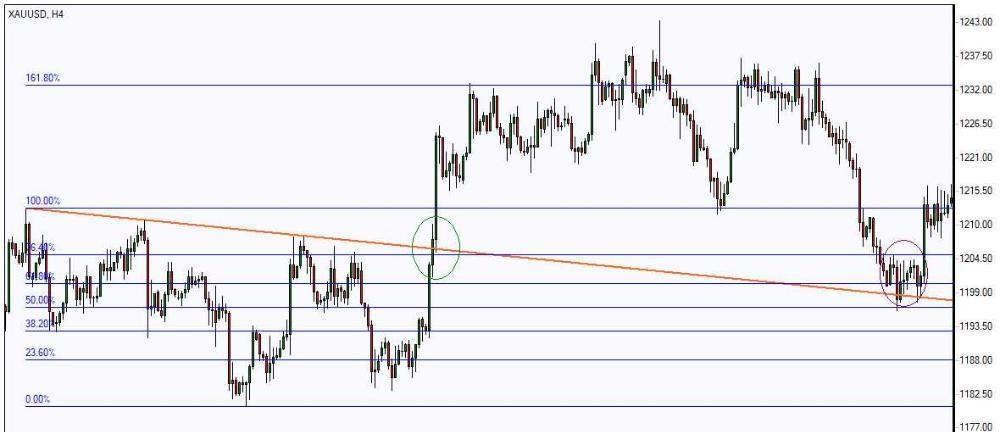
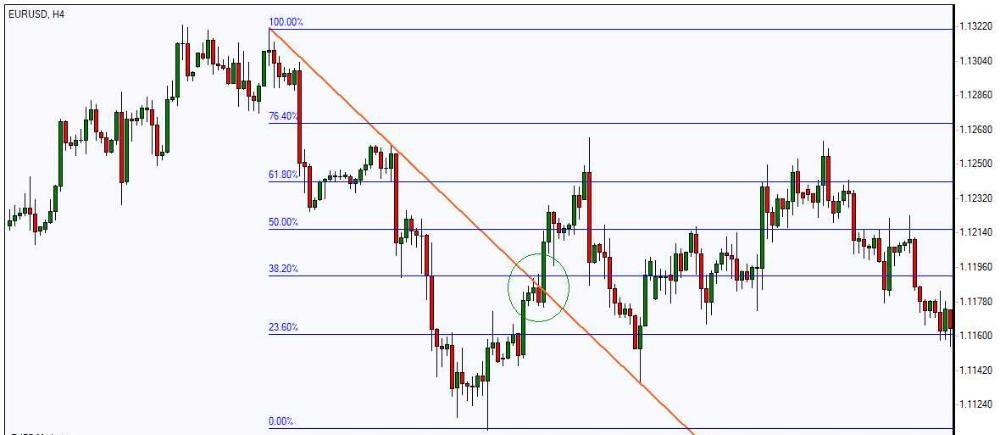
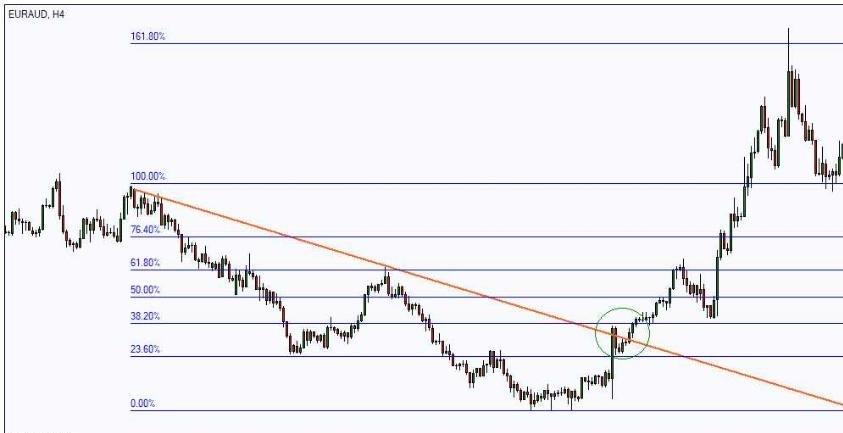
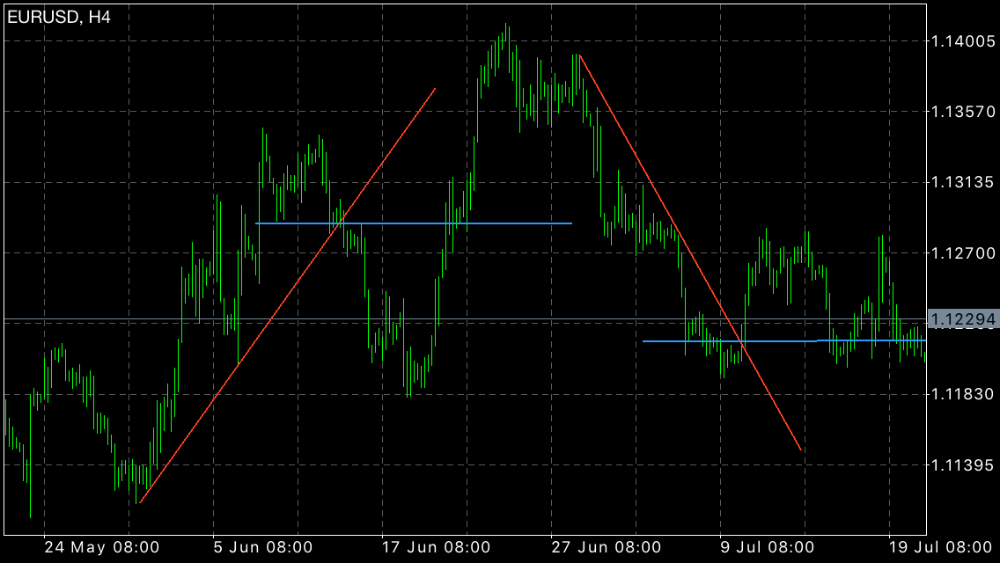
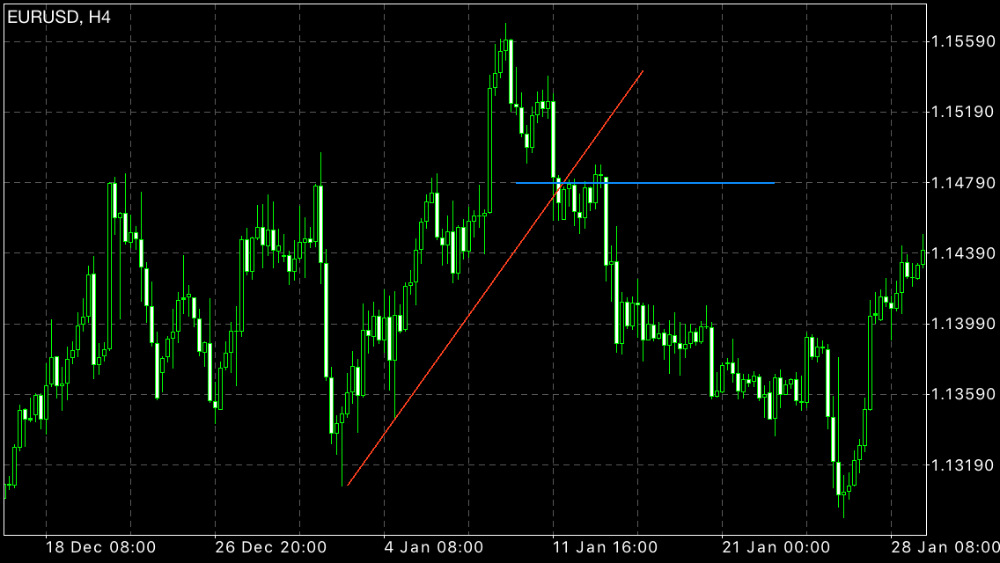
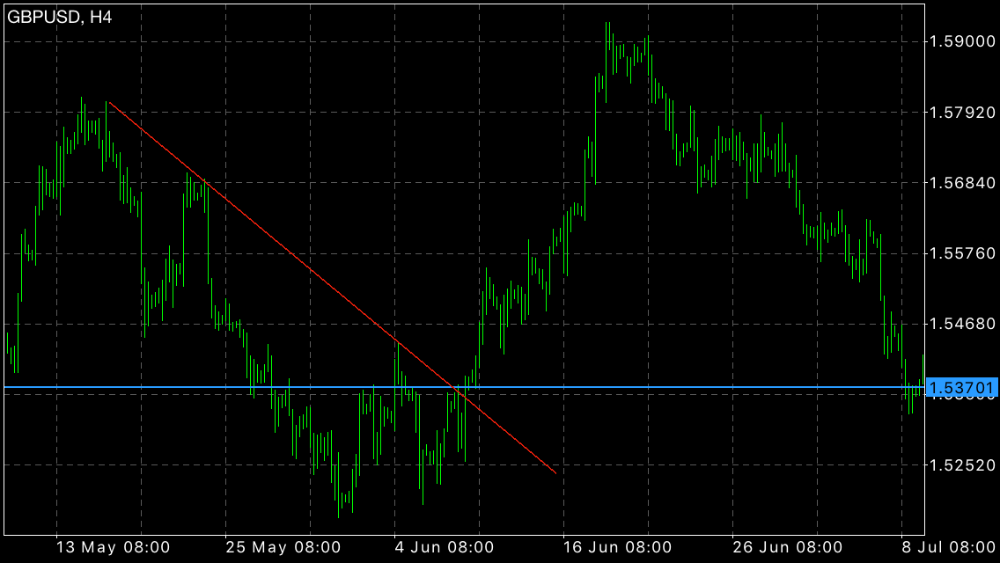
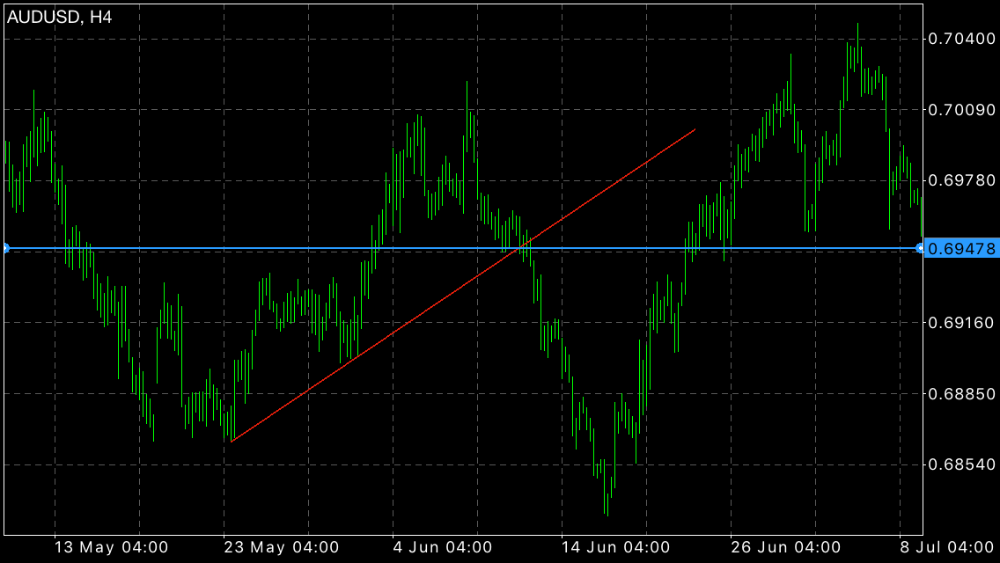
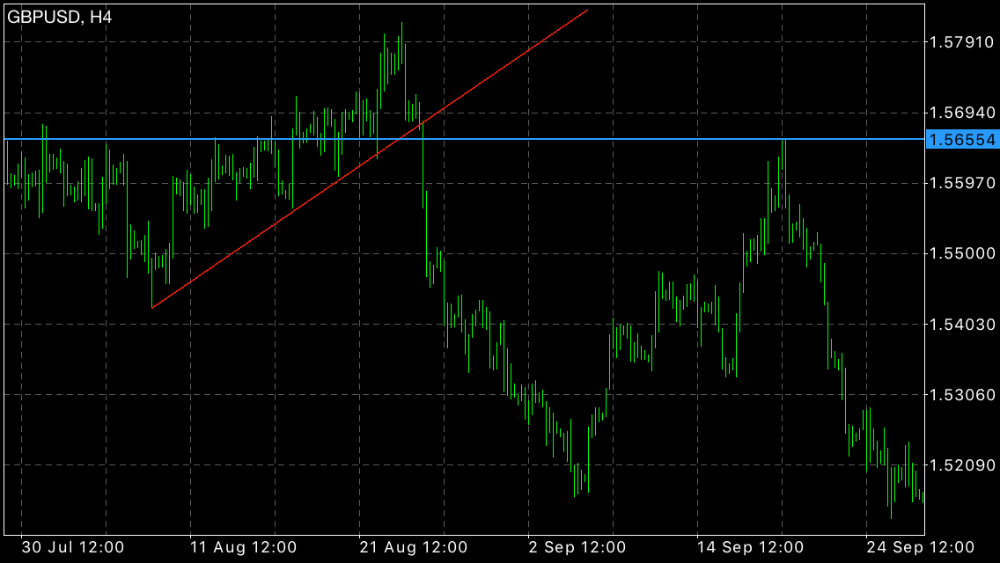
A very smart computer makes the charts. I'm going to explain how the computer works. Look at the three pictures. When the price breaks a trend line, after a time-span, the price will come back to the break point. The time-span can be short or very long. It often happens. About 95%. You can check the past. You will find so many samples. It happens in every time frames. 15M , H1 , H4 , Daily , Weekly. But H4 is the best. Draw the trend lines from the tip of the bars.
Three examples:
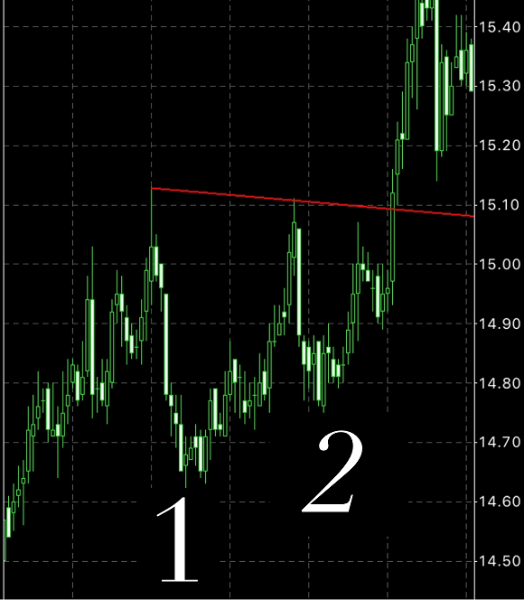
True Trend Line Look at the two pictures. The first picture: False Because the second peak is not below the first peak. The second picture: True The second peak is below the first peak.
Draw the trend lines from the tip of the bars. The trend line should touch the first and second peaks. It’s so important. Some people don’t care about the second peak.
How to trade? You should trade when the price comes back to the break point.It often happens. About 95%. You need experience. Check the past to see more examples.
How to find the return points? You can use Fibonacci for finding the return points. Draw the Fibonacci from the start point of the trend line and end it at the highest or the lowest bar before the break point. In these picture, the price has returned after touching the 161.80% or 61.80% of the Fibonacci.
Discussion Forum / 论坛 / منتدى للنقاش/ Diễn đàn thảo luận/
-
Disclaimer : The purpose of this website is to be a place for learning and discussion. The website and each tutorial topics do not encourage anyone to participate in trading or investment of any kind. Any information shown in any part of this website do not promise any movement, gains, or profit for any trader or non-trader.
By viewing any material or using the information within this site, you agree that it is general educational material whether it is about learning trading online or not and you will not hold anybody responsible for loss or damages resulting from the content provided here. It doesn't matter if this website contain a materials related to any trading. Investing in financial product is subject to market risk. Financial products, such as stock, forex, commodity, and cryptocurrency, are known to be very speculative and any investment or something related in them should done carefully, desirably with a good personal risk management.
Prices movement in the past and past performance of certain traders are by no means an assurance of future performance or any stock, forex, commodity, or cryptocurrency market movement. This website is for informative and discussion purpose in this website only. Whether newbie in trading, part-time traders, or full time traders. No one here can makes no warranties or guarantees in respect of the content, whether it is about the trading or not. Discussion content reflects the views of individual people only. The website bears no responsibility for the accuracy of forum member’s comments whether about learning forex online or not and will bear no responsibility or legal liability for discussion postings.
Any tutorial, opinions and comments presented on this website do not represent the opinions on who should buy, sell or hold particular investments, stock, forex currency pairs, commodity, or any products or courses. Everyone should conduct their own independent research before making any decision.
The publications herein do not take into account the investment objectives, financial situation or particular needs of any particular person. You should obtain individual trading advice based on your own particular circumstances before making an investment decision on the basis of information about trading and other matter on this website.
As a user, you should agree, through acceptance of these terms and conditions, that you should not use this forum to post any content which is abusive, vulgar, hateful, and harassing to any traders and non-traders.
Tuyên bố từ chối trách nhiệm Mục đích của trang web này là một nơi để học hỏi và thảo luận. Trang web và mỗi chủ đề hướng dẫn không khuyến khích bất kỳ ai tham gia giao dịch hoặc đầu tư dưới bất kỳ hình thức nào. Bất kỳ thông tin nào được hiển thị trong bất kỳ phần nào của trang web này không hứa hẹn bất kỳ chuyển động, lợi nhuận hoặc lợi nhuận nào cho bất kỳ nhà kinh doanh hoặc không phải nhà kinh doanh nào.
Bằng cách xem bất kỳ tài liệu nào hoặc sử dụng thông tin trong trang web này, bạn đồng ý rằng đó là tài liệu giáo dục chung cho dù đó là về việc học giao dịch trực tuyến hay không và bạn sẽ không chịu bất kỳ ai chịu trách nhiệm về mất mát hoặc thiệt hại do nội dung được cung cấp ở đây. Không quan trọng nếu trang web này có chứa tài liệu liên quan đến bất kỳ giao dịch nào. Đầu tư vào sản phẩm tài chính phải chịu rủi ro thị trường. Các sản phẩm tài chính, chẳng hạn như chứng khoán, ngoại hối, hàng hóa và tiền điện tử, được biết là rất đầu cơ và bất kỳ khoản đầu tư nào hoặc thứ gì đó liên quan đến chúng đều phải được thực hiện cẩn thận, không cần thiết với việc quản lý rủi ro cá nhân tốt.
Chuyển động giá trong quá khứ và hiệu suất trong quá khứ của một số nhà giao dịch nhất định không có nghĩa là đảm bảo cho hoạt động trong tương lai hoặc bất kỳ chuyển động nào của thị trường chứng khoán, ngoại hối, hàng hóa hoặc tiền điện tử. Trang web này chỉ dành cho mục đích thông tin và thảo luận trong trang web này. Cho dù là người mới tham gia giao dịch, người giao dịch bán thời gian hay người giao dịch toàn thời gian. Không ai ở đây có thể không đảm bảo hoặc đảm bảo về nội dung, cho dù đó là về giao dịch hay không. Nội dung thảo luận chỉ phản ánh quan điểm của từng cá nhân. Trang web không chịu trách nhiệm về tính chính xác của các bình luận của thành viên diễn đàn về việc học ngoại hối trực tuyến hay không và sẽ không chịu trách nhiệm pháp lý hoặc trách nhiệm pháp lý đối với các bài đăng thảo luận.
Bất kỳ hướng dẫn, ý kiến và nhận xét nào được trình bày trên trang web này không đại diện cho ý kiến về việc ai nên mua, bán hoặc nắm giữ các khoản đầu tư cụ thể, chứng khoán, các cặp tiền tệ ngoại hối, hàng hóa, hoặc bất kỳ sản phẩm hoặc khóa học nào. Mọi người nên tiến hành nghiên cứu độc lập của riêng mình trước khi đưa ra bất kỳ quyết định nào.
Các ấn phẩm ở đây không tính đến mục tiêu đầu tư, tình hình tài chính hoặc nhu cầu cụ thể của bất kỳ cá nhân cụ thể nào. Bạn nên nhận lời khuyên giao dịch cá nhân dựa trên hoàn cảnh cụ thể của riêng bạn trước khi đưa ra quyết định đầu tư trên cơ sở thông tin về giao dịch và các vấn đề khác trên trang web này.
Với tư cách là người dùng, bạn nên đồng ý, thông qua việc chấp nhận các điều khoản và điều kiện này, rằng bạn không nên sử dụng diễn đàn này để đăng bất kỳ nội dung nào lạm dụng, thô tục, thù hận và quấy rối đối với bất kỳ thương nhân và những người không phải là thương nhân.
تنصل الغرض من هذا الموقع هو أن يكون مكانًا للتعلم والمناقشة. لا يشجع موقع الويب وكل موضوع تعليمي أي شخص على المشاركة في التداول أو الاستثمار من أي نوع. أي معلومات معروضة في أي جزء من هذا الموقع لا تعد بأي حركة أو مكاسب أو ربح لأي متداول أو غير متداول.
من خلال عرض أي مادة أو استخدام المعلومات الموجودة في هذا الموقع ، فإنك توافق على أنها مادة تعليمية عامة سواء كانت تتعلق بتعلم التداول عبر الإنترنت أم لا ، ولن تتحمل أي شخص المسؤولية عن الخسارة أو الأضرار الناتجة عن المحتوى المقدم هنا. لا يهم إذا كان هذا الموقع يحتوي على مواد متعلقة بأي تداول. الاستثمار في المنتجات المالية عرضة لمخاطر السوق. من المعروف أن المنتجات المالية ، مثل الأسهم والفوركس والسلع والعملات المشفرة ، مضاربة للغاية وأي استثمار أو شيء مرتبط بها يجب أن يتم بعناية ، ومن المرغوب فيه مع إدارة مخاطر شخصية جيدة.
حركة الأسعار في الماضي والأداء السابق لبعض المتداولين ليست بأي حال من الأحوال ضمانًا للأداء المستقبلي أو أي حركة في سوق الأسهم أو العملات الأجنبية أو السلع أو العملات المشفرة. هذا الموقع هو لغرض إعلامي ومناقشة في هذا الموقع فقط. سواء كان مبتدئًا في التداول ، أو متداولين بدوام جزئي ، أو متداولين بدوام كامل. لا يمكن لأي شخص هنا تقديم أي ضمانات أو ضمانات فيما يتعلق بالمحتوى ، سواء كان الأمر يتعلق بالتداول أم لا. يعكس محتوى المناقشة وجهات نظر الأفراد فقط. لا يتحمل موقع الويب أي مسؤولية عن دقة تعليقات أعضاء المنتدى سواء حول تعلم الفوركس عبر الإنترنت أم لا ، ولن يتحمل أي مسؤولية أو مسؤولية قانونية عن منشورات المناقشة.
لا يمثل أي برنامج تعليمي وآراء وتعليقات مقدمة على هذا الموقع الآراء حول من يجب عليه شراء أو بيع أو الاحتفاظ باستثمارات معينة أو أسهم أو أزواج عملات فوركس أو سلعة أو أي منتجات أو دورات تدريبية. يجب على الجميع إجراء أبحاثهم المستقلة قبل اتخاذ أي قرار.
لا تأخذ المنشورات الواردة هنا في الاعتبار أهداف الاستثمار أو الوضع المالي أو الاحتياجات الخاصة لأي شخص معين. يجب أن تحصل على مشورة تداول فردية بناءً على ظروفك الخاصة قبل اتخاذ قرار استثماري على أساس المعلومات المتعلقة بالتداول والأمور الأخرى على هذا الموقع.
بصفتك مستخدمًا ، يجب أن توافق ، من خلال قبول هذه الشروط والأحكام ، على عدم استخدام هذا المنتدى لنشر أي محتوى مسيء ومبتذل وكراهية ومضايقة لأي متداولين وغير متداولين.